Continued Rally Sets Up A More Sinister Market
With the rally trying to push directly higher to complete this b-wave sooner than expected, it can set up a very sinister c-wave drop once everyone gets confident that the bull market is back. And, this direct drive to 2800 and higher seems to be doing its trick.
While we have always expected this market to come back to at least the 2800 region, and even potentially make a higher high for this b-wave, there is no question that I did not expect it to take a direct route. And, as long as we hold over the 2730/40 support region, I have to view the potential that this is the path the market is now choosing.
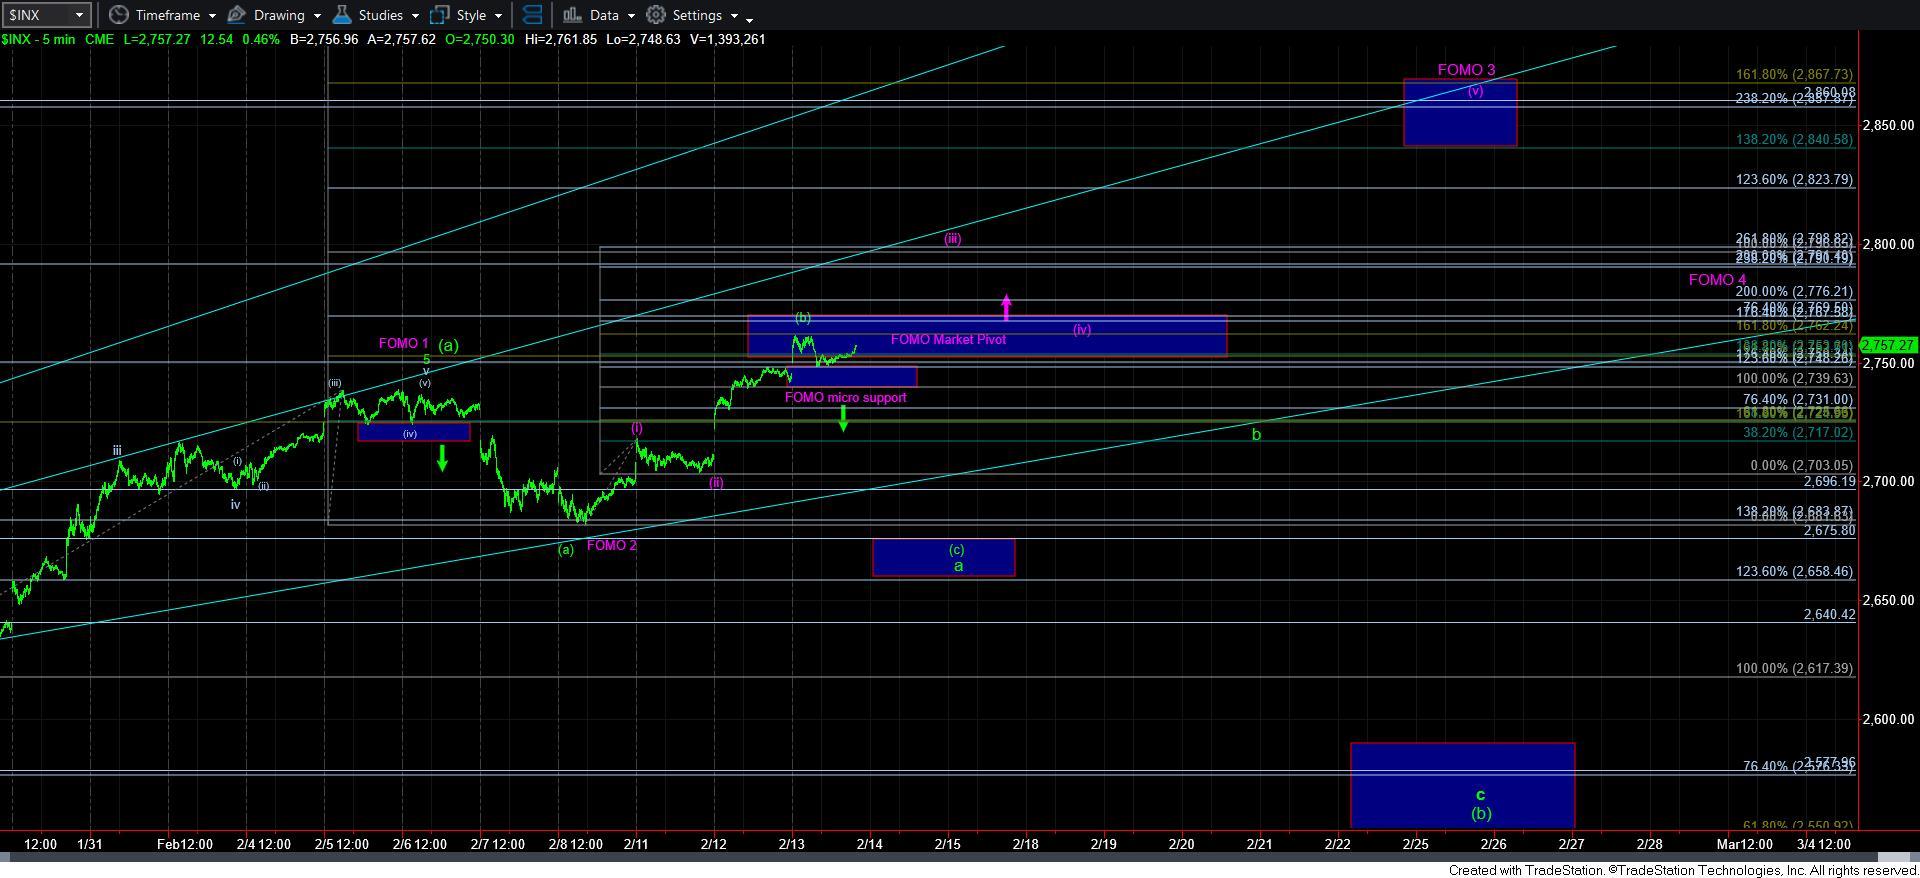
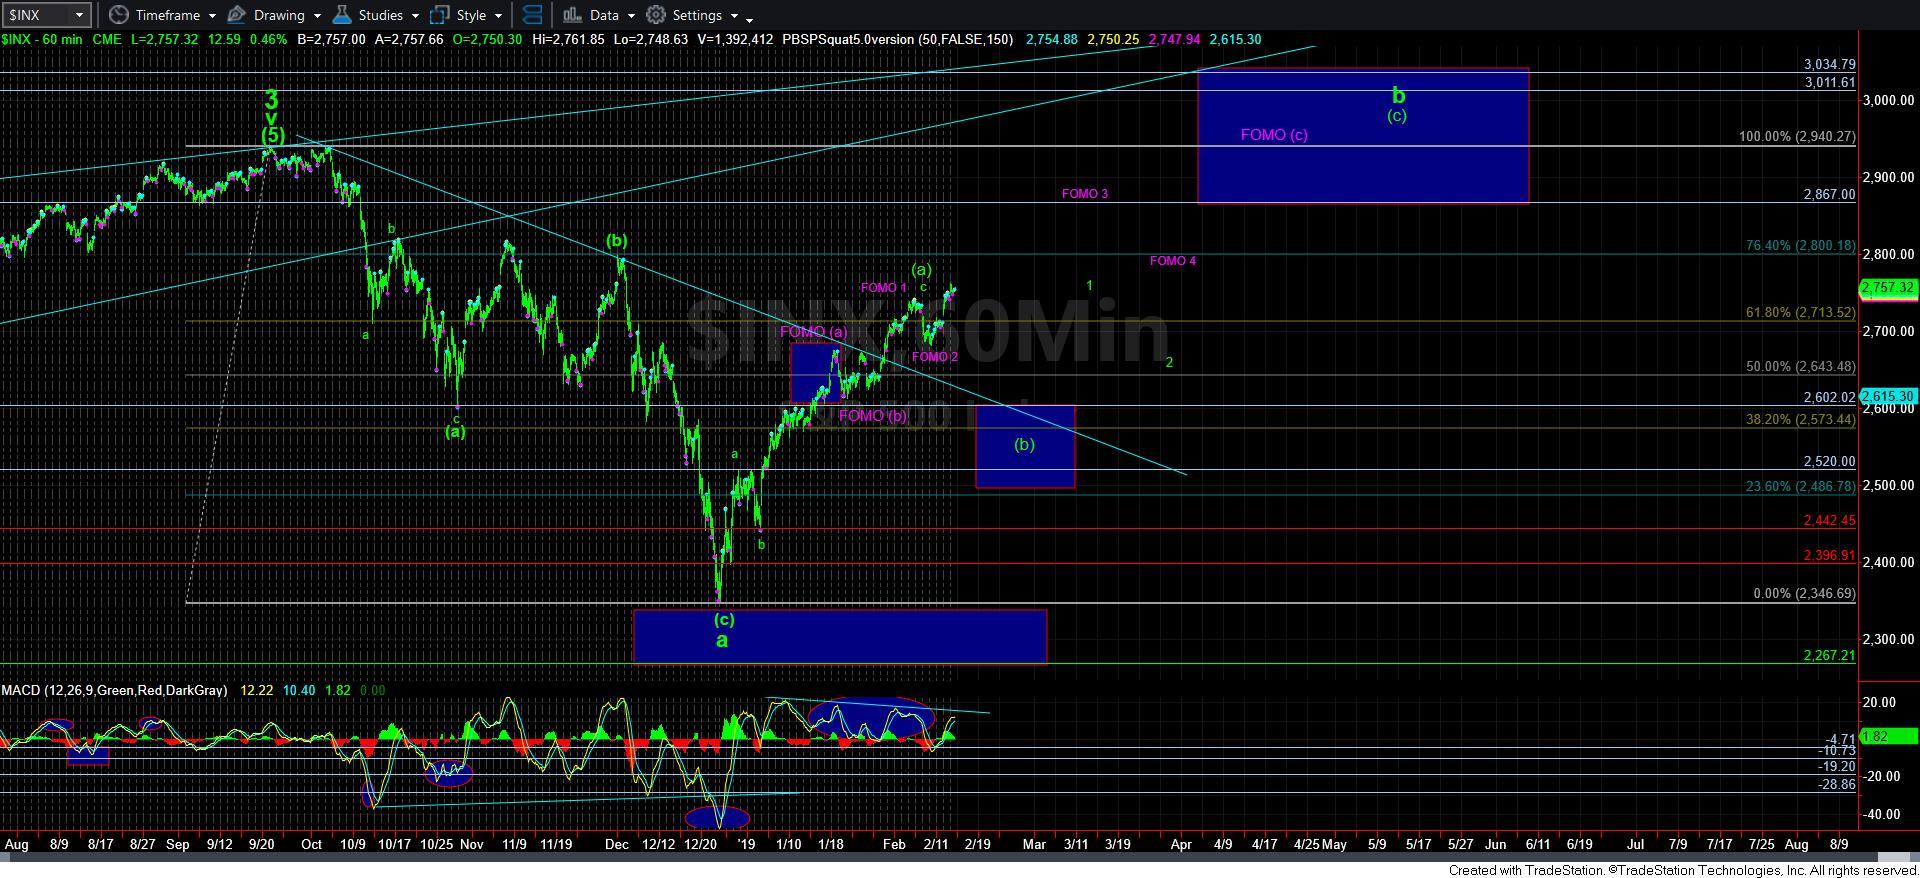
Should the market be able to break down below 2730SPX, then I can go back to considering the bigger [a][b][c] structure we have been tracking, albeit with an exceptionally stretched [a] wave. But, as long as it continues to hold support, it has a path up as high as the 2910-2940SPX region, which is our FOMO count presented in purple. Again, it has clearly not been my preference, but due to the market break out yesterday, and holding support thus far, I have to take this potential quite seriously, as the path remains open to 2900 now in a more direct fashion.
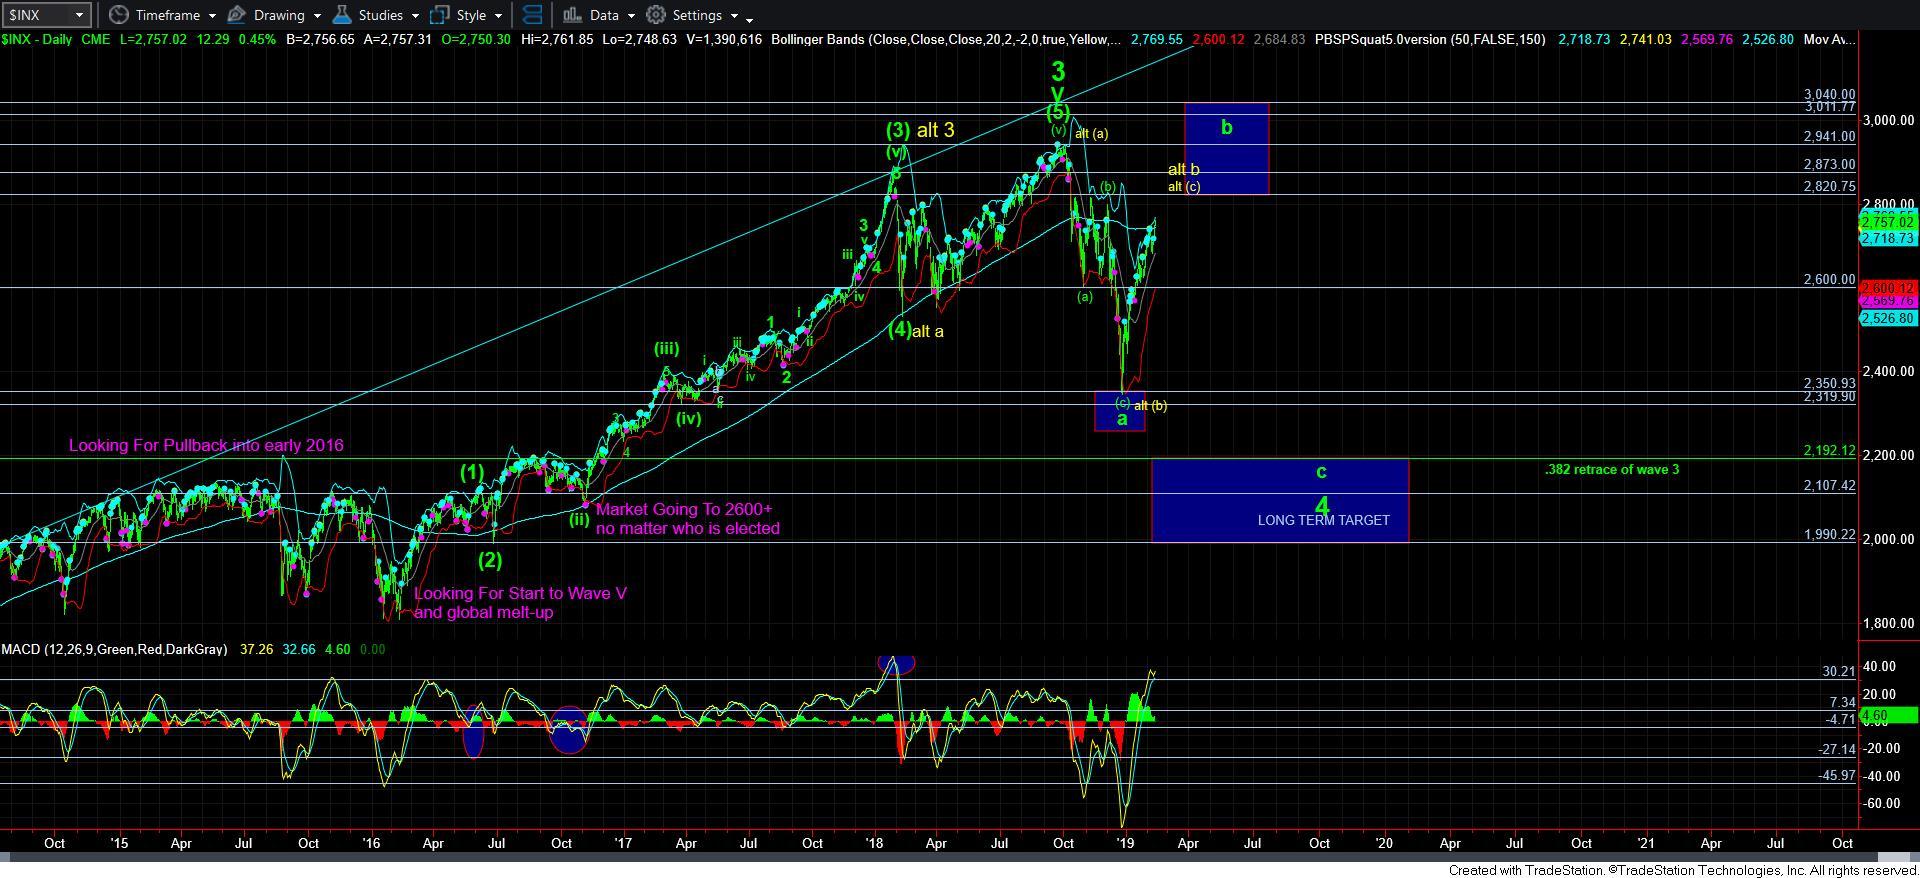
Yet, along the way, we will likely have potential tests and pitfalls. Should the market be able to rally directly towards that 2800SPX region, I have to consider an alternative count, which is now presented as the alternative yellow count on my daily chart. This is a rather complex count for this 4th wave, but, despite its complexity, it actually solves a lot of the problems we have had with the action we have seen since the top of the market struck in January of 2018.
However, while I will have this alternative on the chart, and I the back of my mind, the ONLY way I would consider this potential is if the market tops out between 2820-2873SPX, and breaks down below 2770SPX in an impulsive manner. IF we see such a pattern develop, then that would tell me that the b-wave has topped in the yellow count, and the market has provided us a wave 1 down in the c-wave. It would also be an initial indication that I would be looking to set up a short trade for the wave 2 retracement, with ultimate targets for the c-wave down still in the 2100-2200SPX region. But, I want to stress that the drop below 2770SPX must be an impulsive 5-wave structure. This is simply something I am now keeping in the back of my mind, and can only adopt should we see such action.
For now, as long as the market continues to maintain support over 2730/40SPX, then we can continue to subdivide higher, as shown in the FOMO count in purple on the 5-minute chart. And, should we continue higher, we will continue to move our support up.
The best way to view this perspective is similar to how we dealt with the market back in the late summer to early fall of 2018. For those that remember, we had targets much higher for the market to complete wave v of 3. But, as we moved up higher in a very overlapping manner, I continued to move our supports up higher as well. It allowed us to continue to look to the long side as long as the market held supports. But, when the market broke 2880SPX, that was the warning that the risks of further upside had risen to the point where I viewed being long as much more dangerous, and that the 20-30% correction we were expecting could begin at any time.
So, at this point in time, that is the manner in which I am forced to view this very stretched market right now. While we certainly did not see a standard [a][b][c] structure for this b-wave rally, the market may very well be attempting a [c] wave rally to the 2900+ region as presented in the FOMO count. And, while there will clearly be pitfalls along the way, as long as the market continues to hold support on the way up, I will continue to look towards that 2900+ region for the FOMO count. However, should we see a sustained break of support on the way up, that will act as the same type of warning which we got when 2880SPX broke back in the fall of 2018.
Again, due to the lack of the standard [b] wave pullback, which I outlined last night, this is the manner in which the market is forcing us to track this rally. For now, 2730/40SPX is the support which must be held to keep pressure to the upside. And, as we move higher, I will be looking for the opportunity to raise that support up to the 2750SPX region should we be able to rally to at least the 2770SPX region.
Lastly, for those that continue to ask about whether all of the bigger wave 4 has completed at the lows of December, as I explained in many prior updates and the live video today, while it is certainly “possible,” the weight of evidence suggests that it has not yet completed. And, as I also noted, since the majority of the stocks we track in the market still look like they need a c-wave down to complete this larger degree wave 4, then that is the view I must take for now. Should something change in that perspective, I will certainly update you. But, remember, the next larger target overhead is a minimum of 3200SPX, but I am starting to warm up to the potential of a bigger blow off top potentially taking us to the 4000 region based upon the significant fund outflows we have seen thus far. Stay tuned.