Context Is Important - Market Analysis for Feb 21st, 2026
This market has been frustrating. What’s more so, it has been frustrating since 2022. But, the question is why has it been frustrating?
Well, normally, the markets move in standard 5-wave structures which makes prognostication and trading so much easier. But, since 2022, this market has been taking shape in waves of 3, which are much more like corrective structures, and are much more variable and difficult to navigate. This is the nature of the beast with which we have been dealing over the last 4 years.
Yet, understanding your environment provides a huge advantage. You see, when you know you are in an environment of 3-wave structures, it tells you that you cannot be as aggressive as you would otherwise. It tells you to be much more picky in the trades you take. And, it tells you that risk management is going to be a key factor upon which you must focus if you are going to emerge from that environment relatively unscathed. Moreover, it should also tell you when to avoid trading within that environment and to look for greener pastures in stock charts that are presenting much more reliable structures.
But, there are times when the market does provide strong clues even within these 3-wave structures. For example, when the market was providing us with a 5-wave decline into the low we struck early this past week, it was a relatively clear point at which one could see it was likely that the market was going to reverse to the upside. And, while I was personally uncertain whether that reversal to the upside was going to lead to higher highs, it was a relatively low-risk point at which one could attempt a long trade (which I noted on the site was my intention), and then see how the rally takes shape to determine if indeed we were setting up for a rally higher.
When the market began to take shape in a very overlapping and uncertain manner, it told me that the only way we were likely going to go higher is with a leading diagonal. And, that told me that I needed to reduce my position size due to the additional uncertainty that the market was presenting, as leading diagonals are not highly reliable trading cues in my opinion. Yet, should the market provide more evidence in the coming week that the leading diagonal will indeed lead us higher, then one can always choose to add positions.
So, the manner in which I use Elliott Wave analysis is not only for actual trade entries and exists, but it also informs me as to the environment within which I am trading or investing. And, that is truly half the battle if you are appropriately focused on risk management.
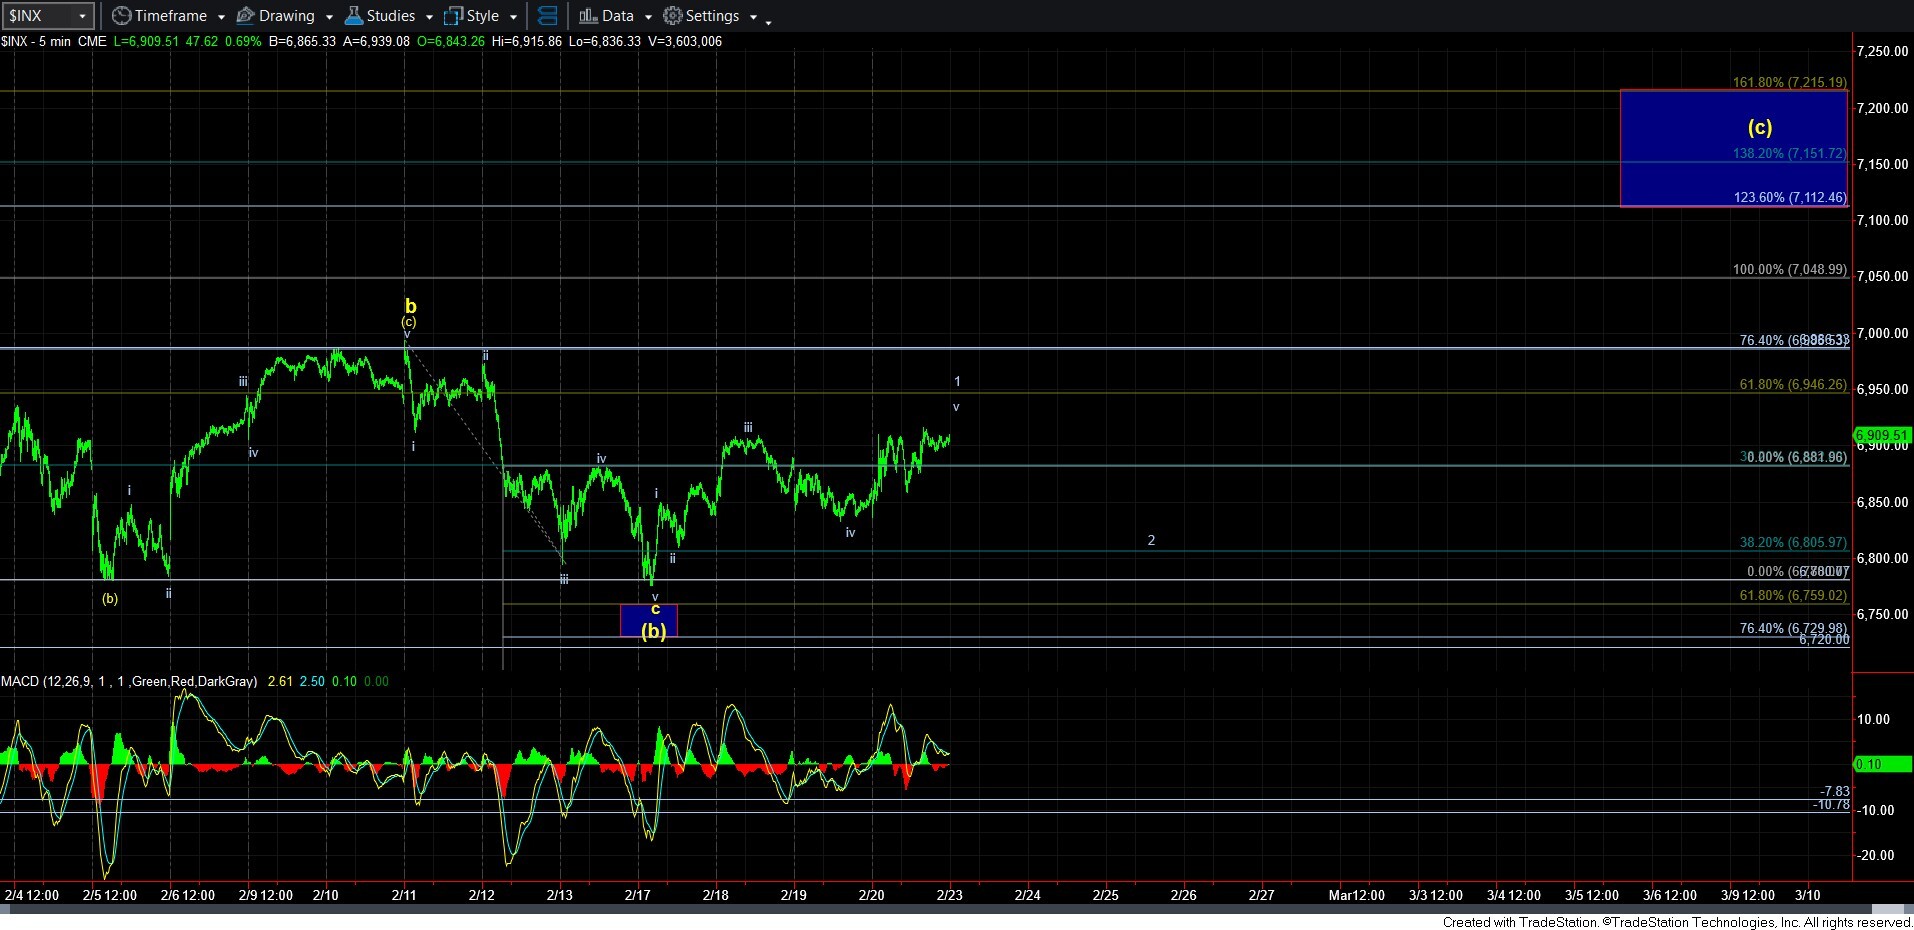
And, that brings me to where we are today. The rally off this past week’s low is an overlapping structure, which can only be bullishly viewed as a leading diagonal for wave 1 of the yellow (c) wave. But, even as far as leading diagonals go, this one is especially ugly.
And, as many of you know, I do not view leading diagonals as especially reliable trading cues. So, in order to make this one a more reliable set up, we will need to see a clearly corrective pullback early in the coming week. And, as long as that corrective pullback holds over this past week’s low, this will project the yellow (c) wave north of 7100SPX, with the actual target depending on where the wave 2 strikes a bottom.
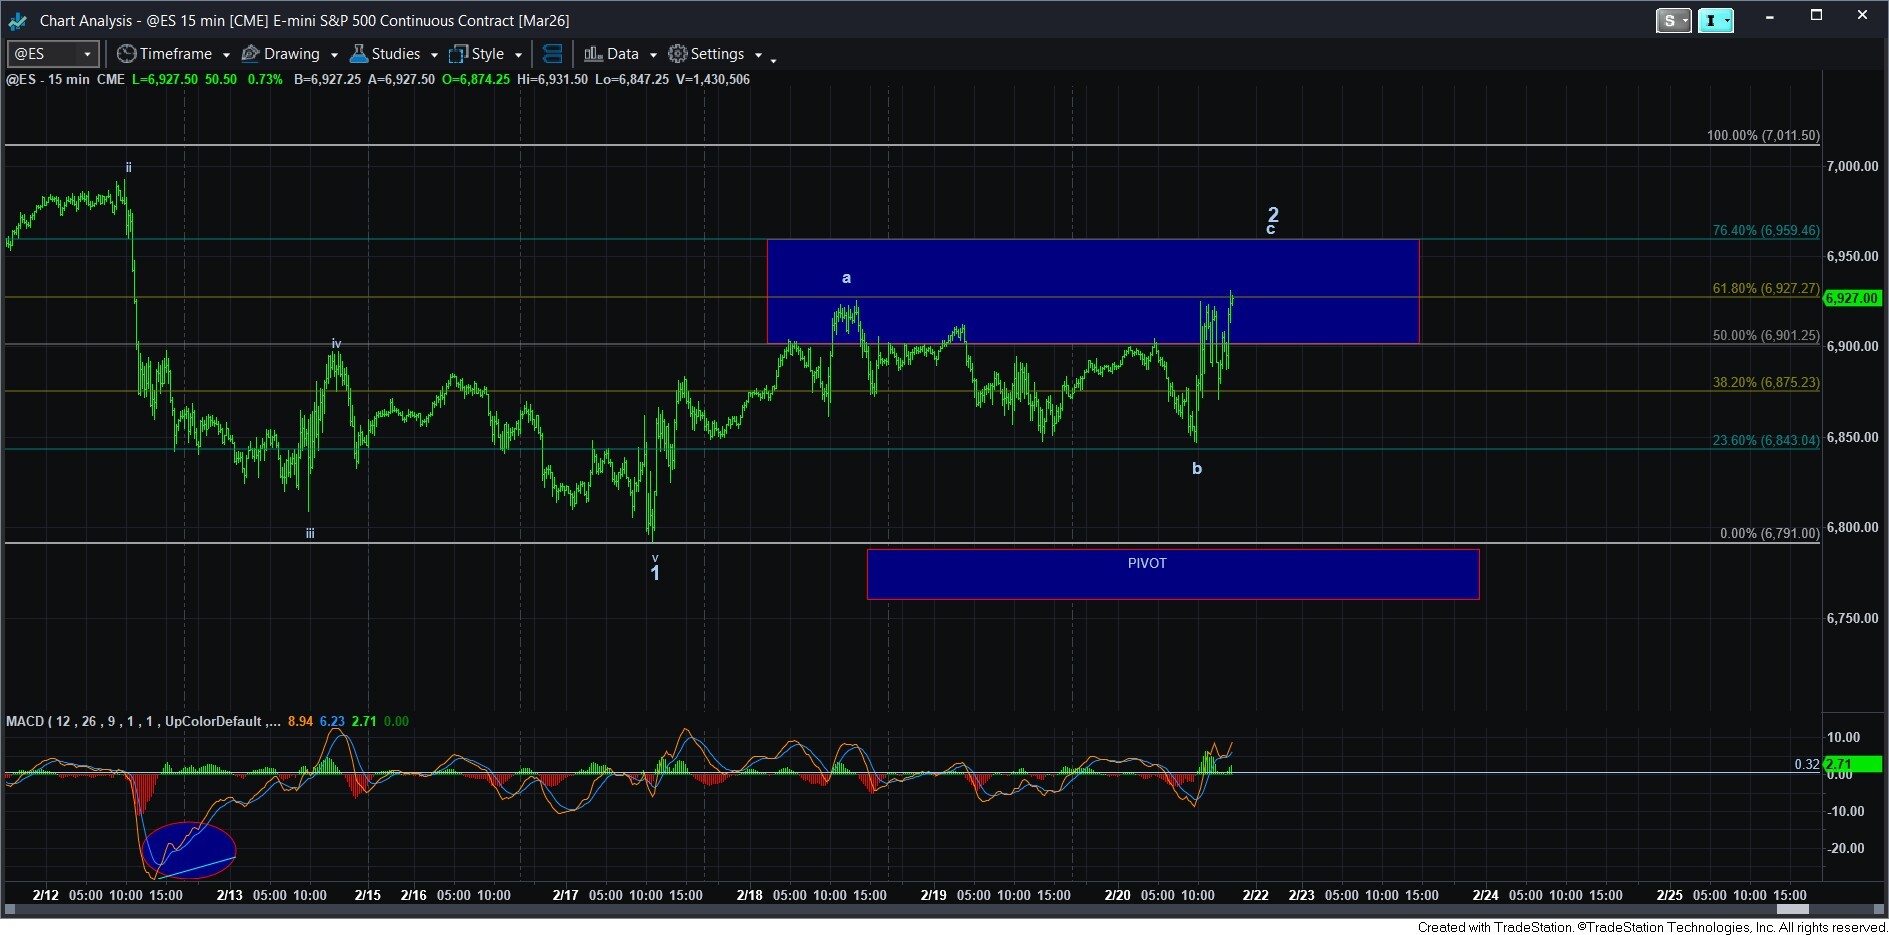
Of course, the alternative count would view the 5-wave decline into low struck this past week as wave 1 of a bigger 5-wave decline. Yet, as I have said, we need to see more evidence that the bears are going to take control of this market before I am able to adopt a bearish count as my primary. So, if we see a 5-wave decline (wave i of 3) followed by a corrective retrace (wave ii of 3), that will increase the probability of the bearish count. And, a follow-through below the low of wave i of 3 will make the bearish count my primary count, with follow-through below 6720SPX making it a higher probability.
The bearish alternative scenario is being presented on the 15-minute ES chart. Moreover, I will adjust the pivot once we have wave 2 in place. And, if you remember, breaking down below the pivot will suggest we are in wave iii of 3, with the pivot then becoming resistance for wave iv of 3. But, I am getting way ahead of myself, as we have no strong evidence yet that the bearish path will be following through. It will have to prove itself as outlined above, as the bulls have retained a strong hold of this market since the April 2025 low.
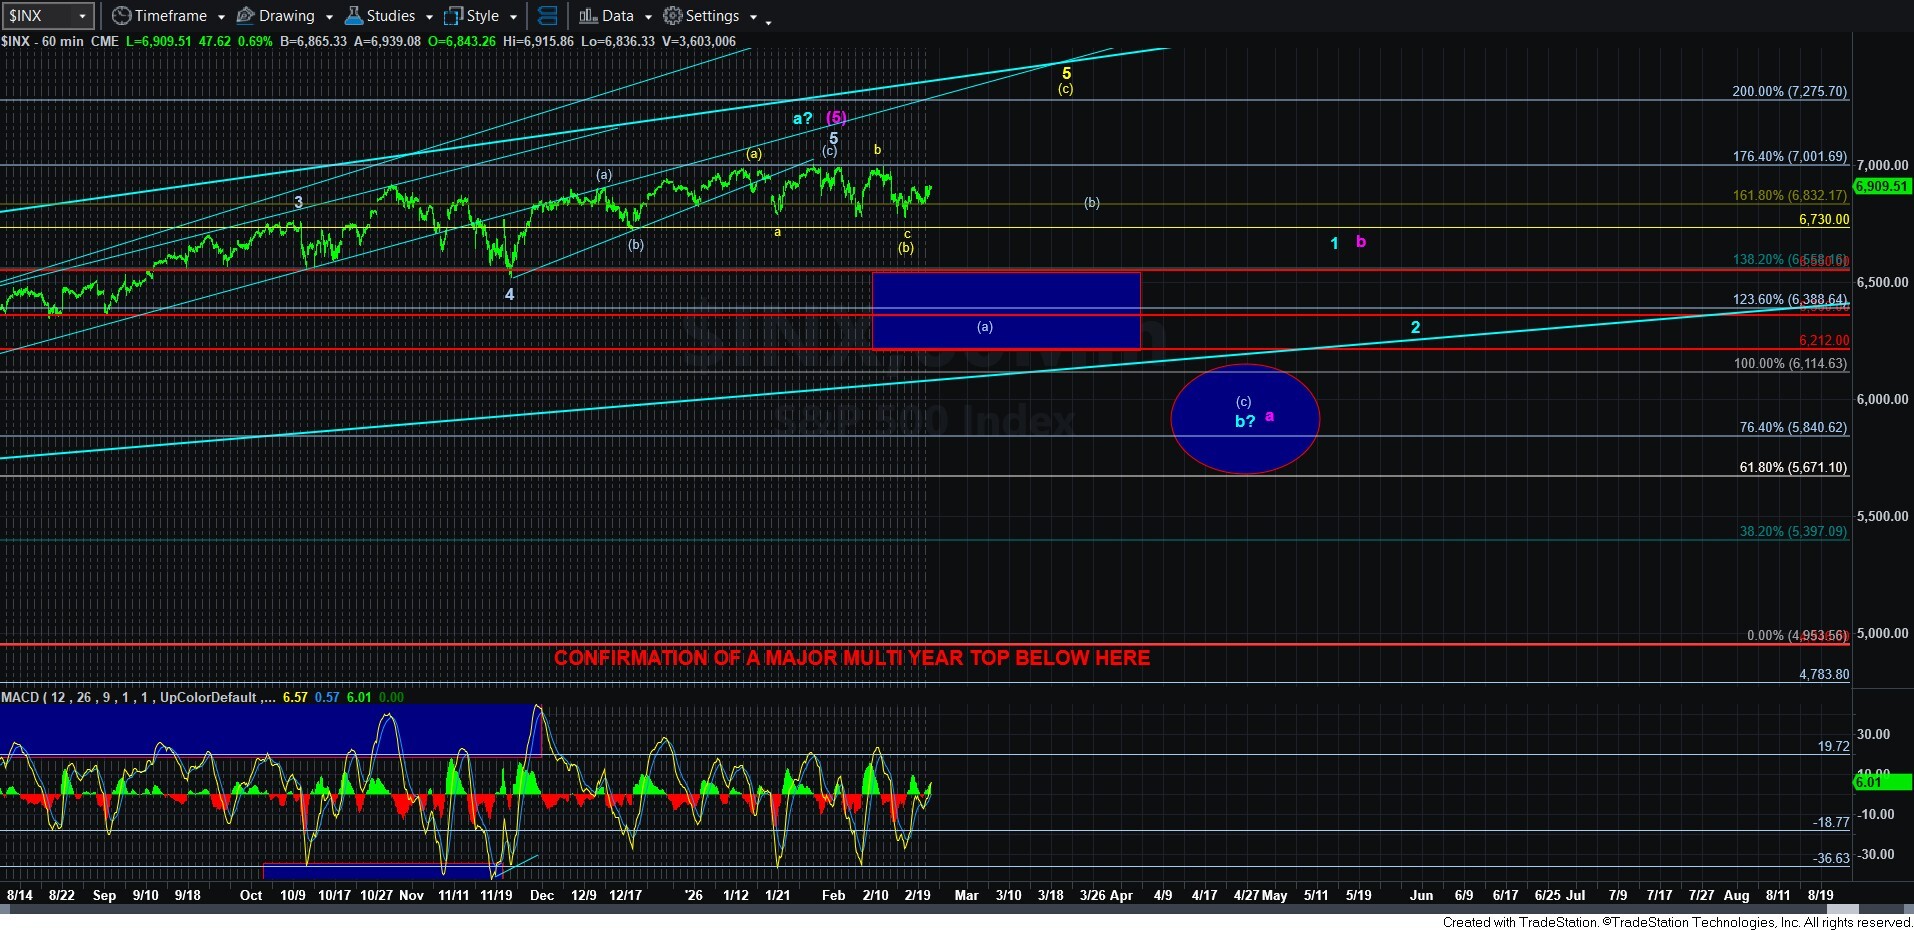
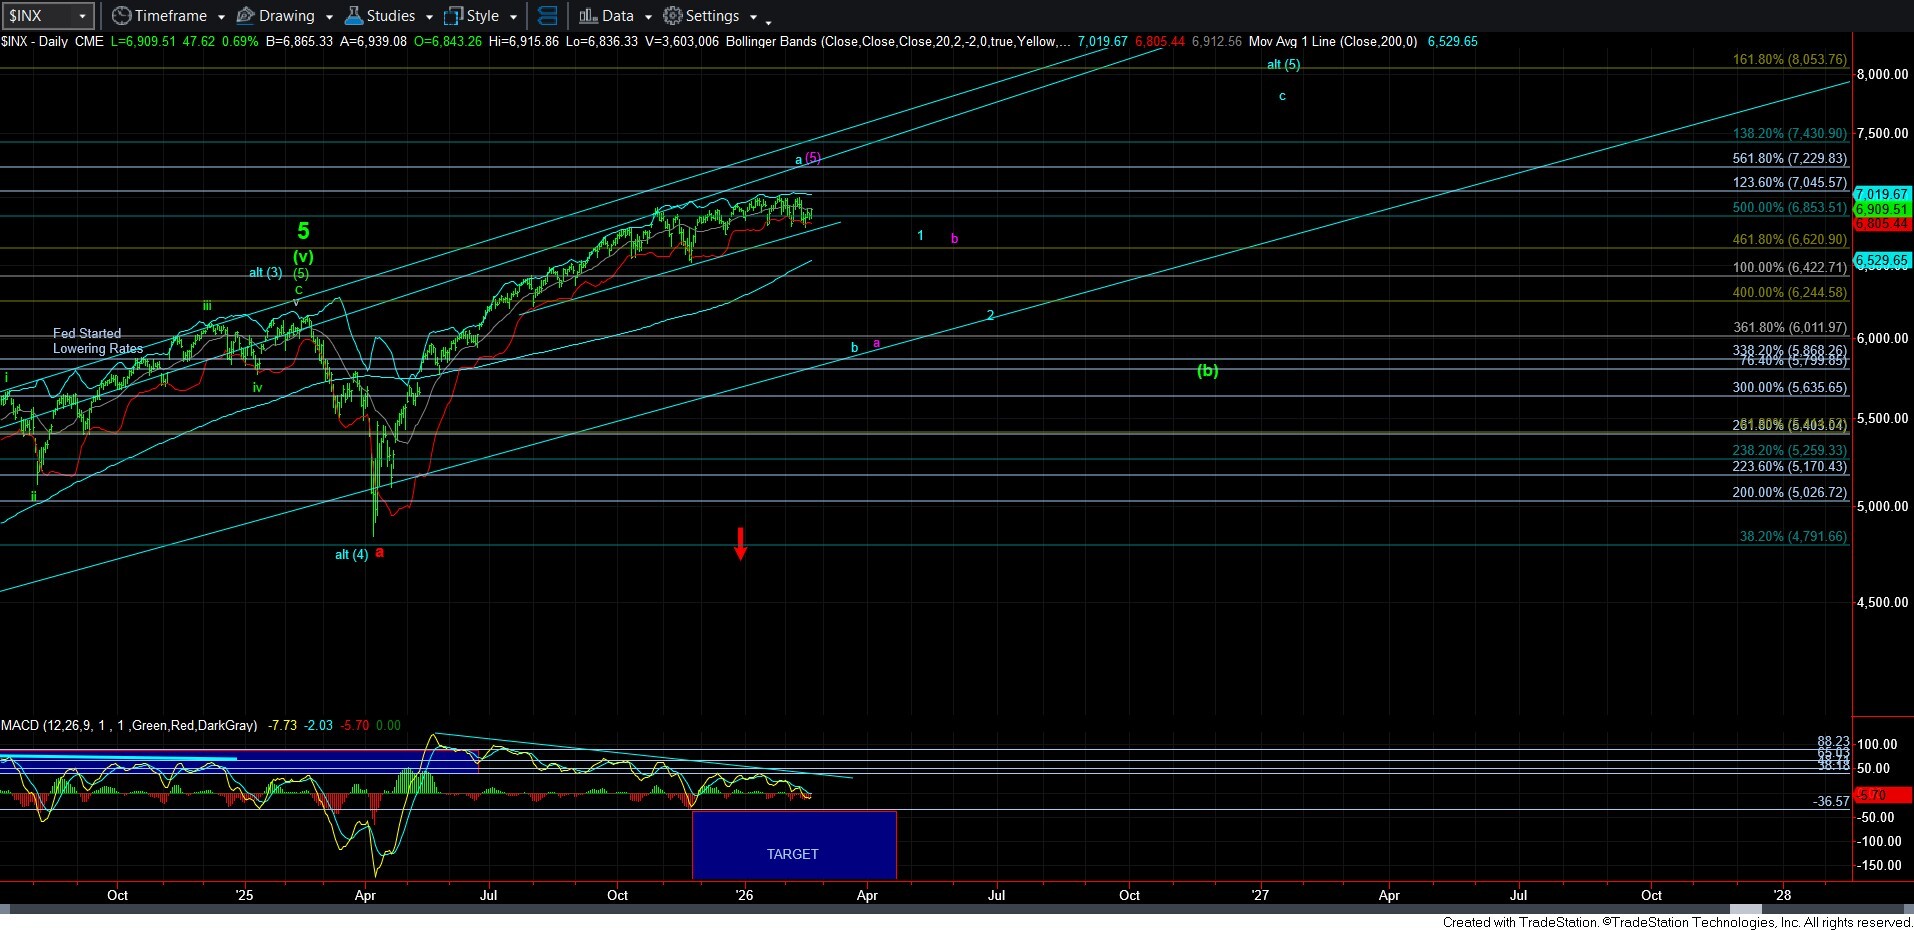
So, in conclusion, I am really forced to give the bulls the benefit of the doubt, especially when both the upside and downside patterns are not terribly clear. So, until the market begins to increase the probability of the downside potential, I am going to be maintaining the bullish scenario as my primary count. But, ultimately, I am still very much of the perspective that we will be testing that 5700-6100SPX region as we move through 2026. Yet, until the market makes it clear that the decline has begun, I am going to give the bulls the benefit of the doubt.