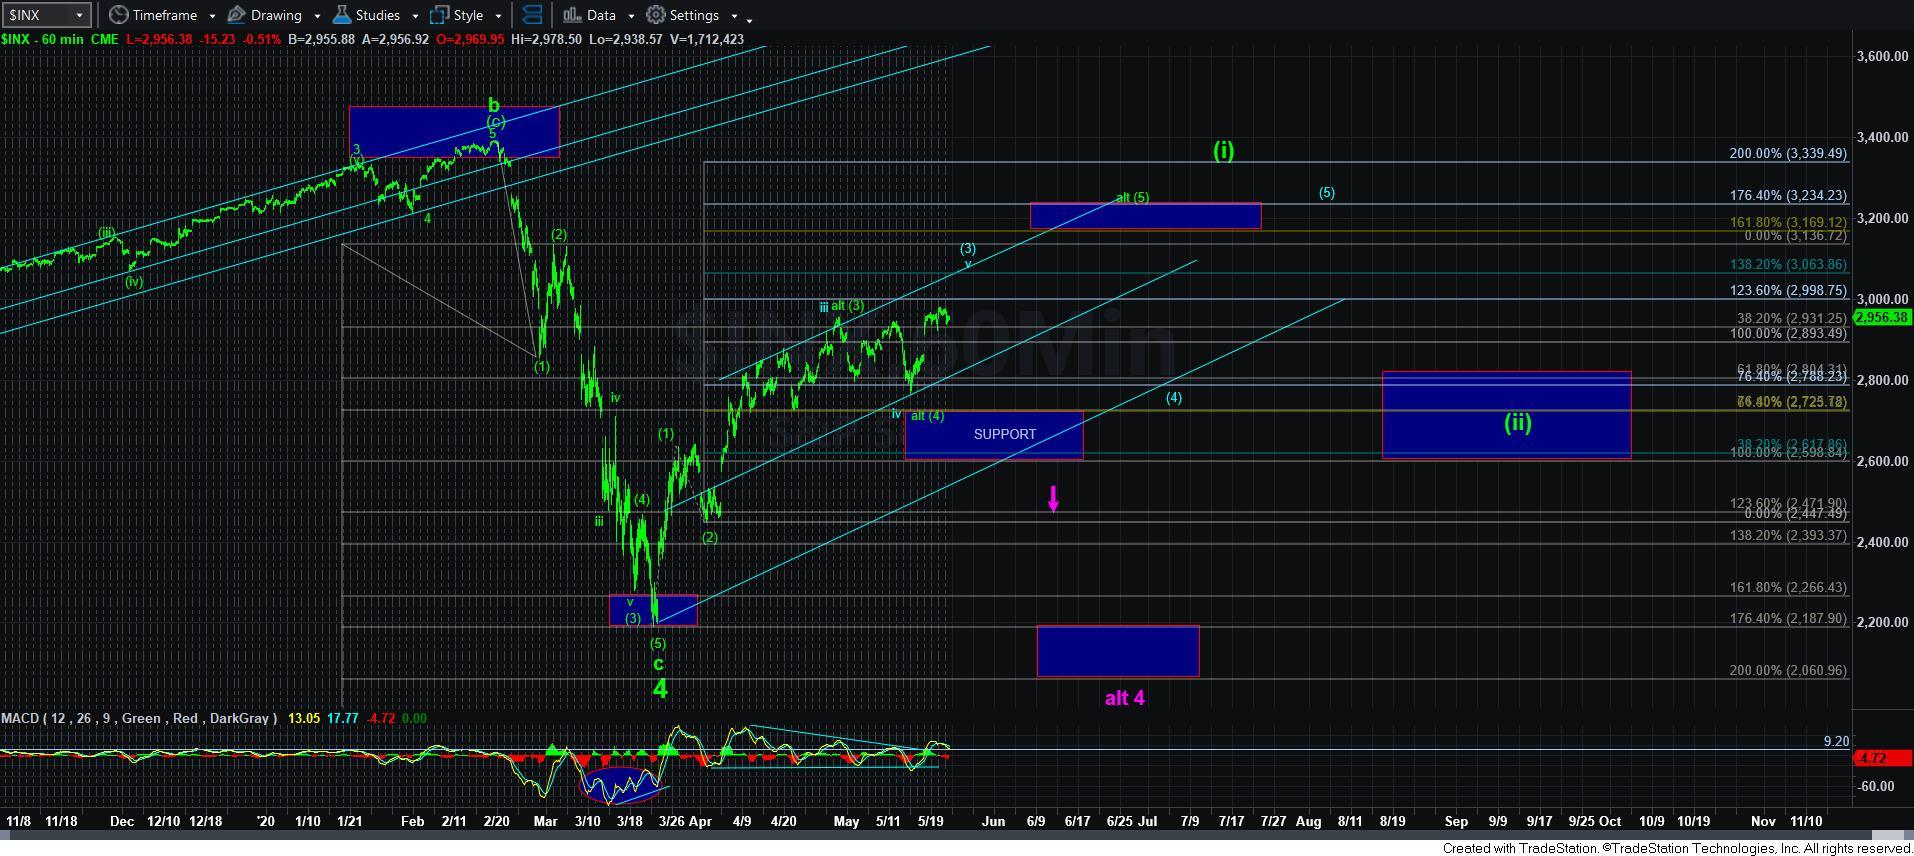
Complex, But Overall Bullish
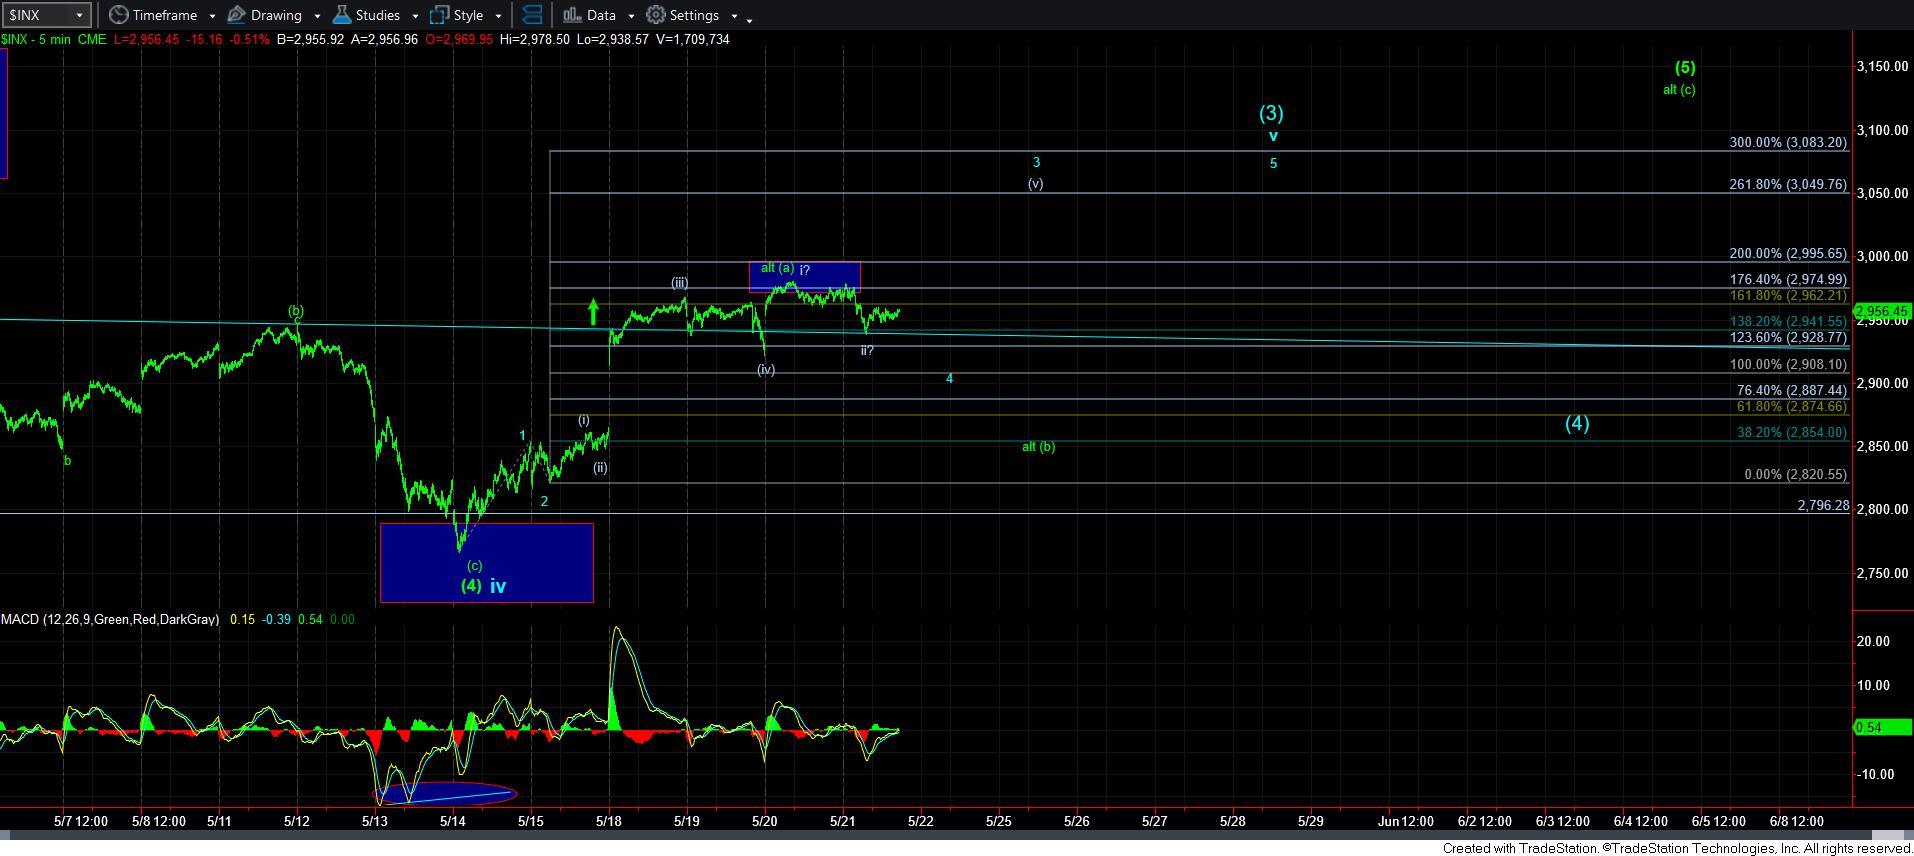
I want to be begin by reiterating that as long as the market maintains over the 2908SPX region, then I am targeting the 3030-3080SPX region sooner rather than later in the blue colored wave count. It would take a break of that support to open the door to the alt [b] wave pullback shown on the 5-minute SPX chart. But, both these patterns are pointing higher in the coming weeks. The path is the only question.
Please take note that the blue count is presented as the primary as long as we remain over 2908SPX, whereas the green count (presented as the “alt” count) will only take hold should we see a sustained break of that support region.
In the micro structure presented on the 5-minute SPX chart, I want to point out a micro bullish pattern, which is in play as long as we hold over today’s pullback low. As you can see on the chart, I would classify the high we struck yesterday as wave i of an extended wave [v] of 3. Again, this would be applicable only if we hold over today’s pullback low, and it points us towards the 3050SPX region just for wave [v] of 3, within wave v of [3] in the blue count.
However, if we break below today’s intra-day pullback low, then it would suggest we will retest the 2908SPX region in wave 4, as presented in blue.
So, overall, I still expect higher levels to be struck in the coming weeks. But, the market is really putting us to the test when it comes to the specific micro-path that is going to take us there. I apologize for the complexity, but we have to deal with the hand we are dealt by the market.