Completing The b-Wave
With the manner in which the market rallied today, you would have thought that they have found the cure for the coronavirus. And, if this does not show you the folly of attempting to align exogenous events with market movement, then I am not sure anything will. But, I digress.
Let’s take a minute to review the bigger picture and then hone in on the smaller picture.
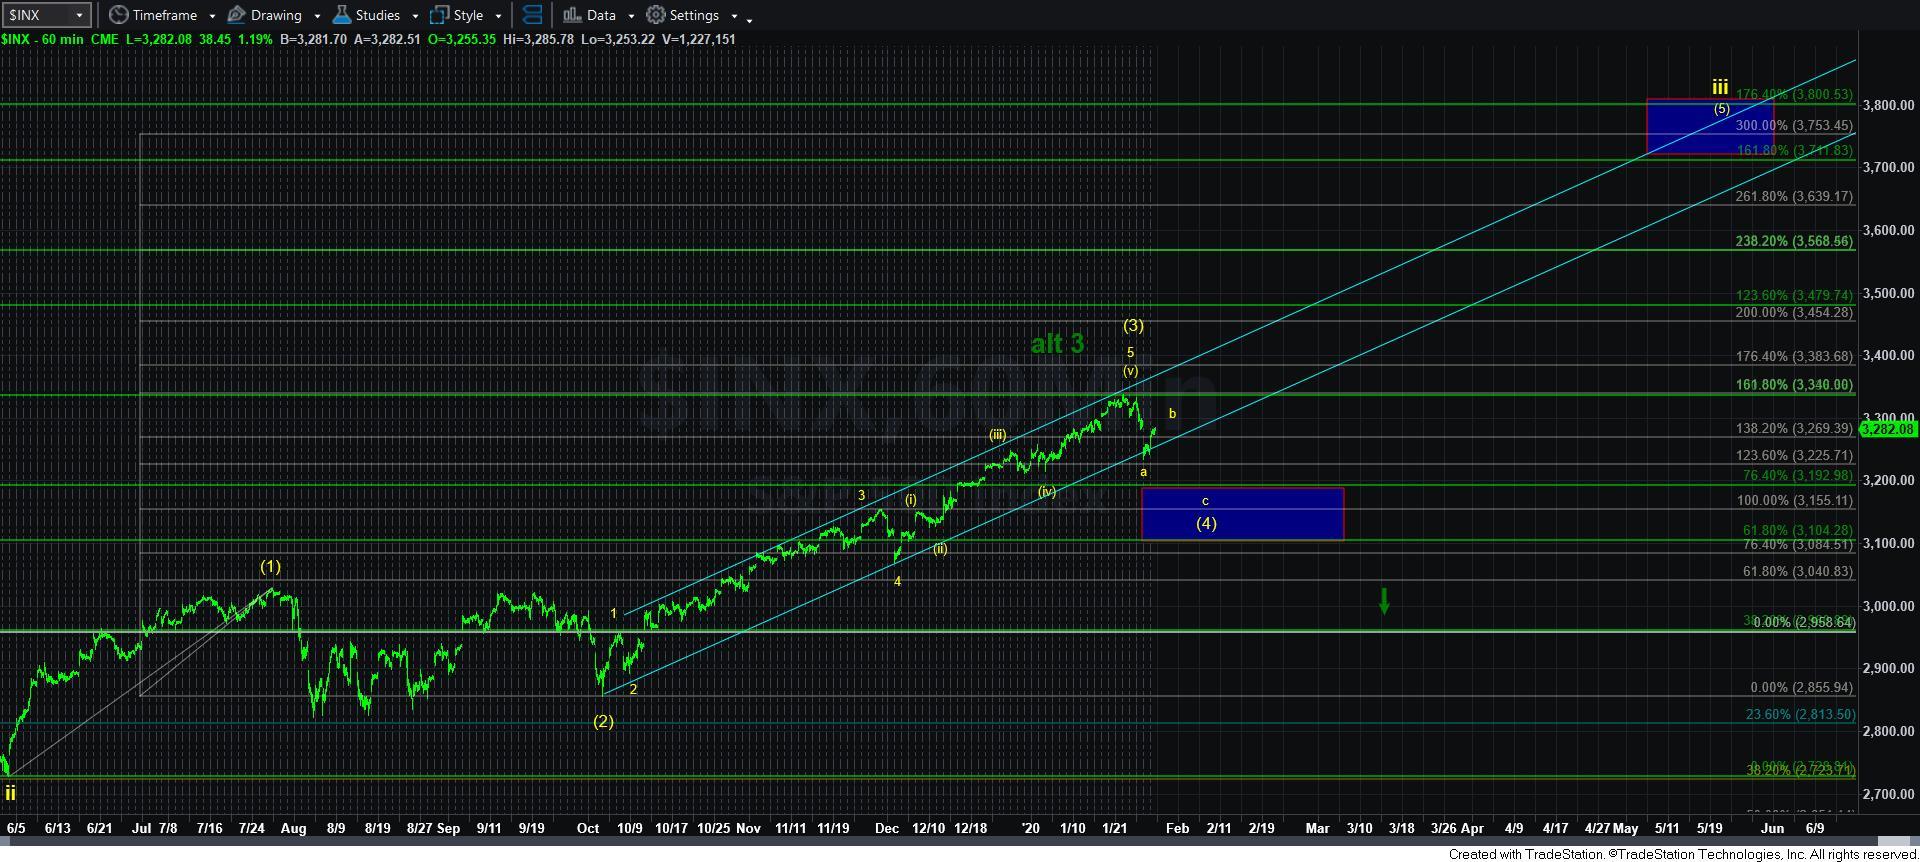
Since we broke out of resistance towards the end of 2019, I begin to track the “yellow” count, which is the most immediate bullish count we have, which is pointing us to the 3700-3800 region potentially this year, with the 4000-4200 region potentially to be seen by next year.
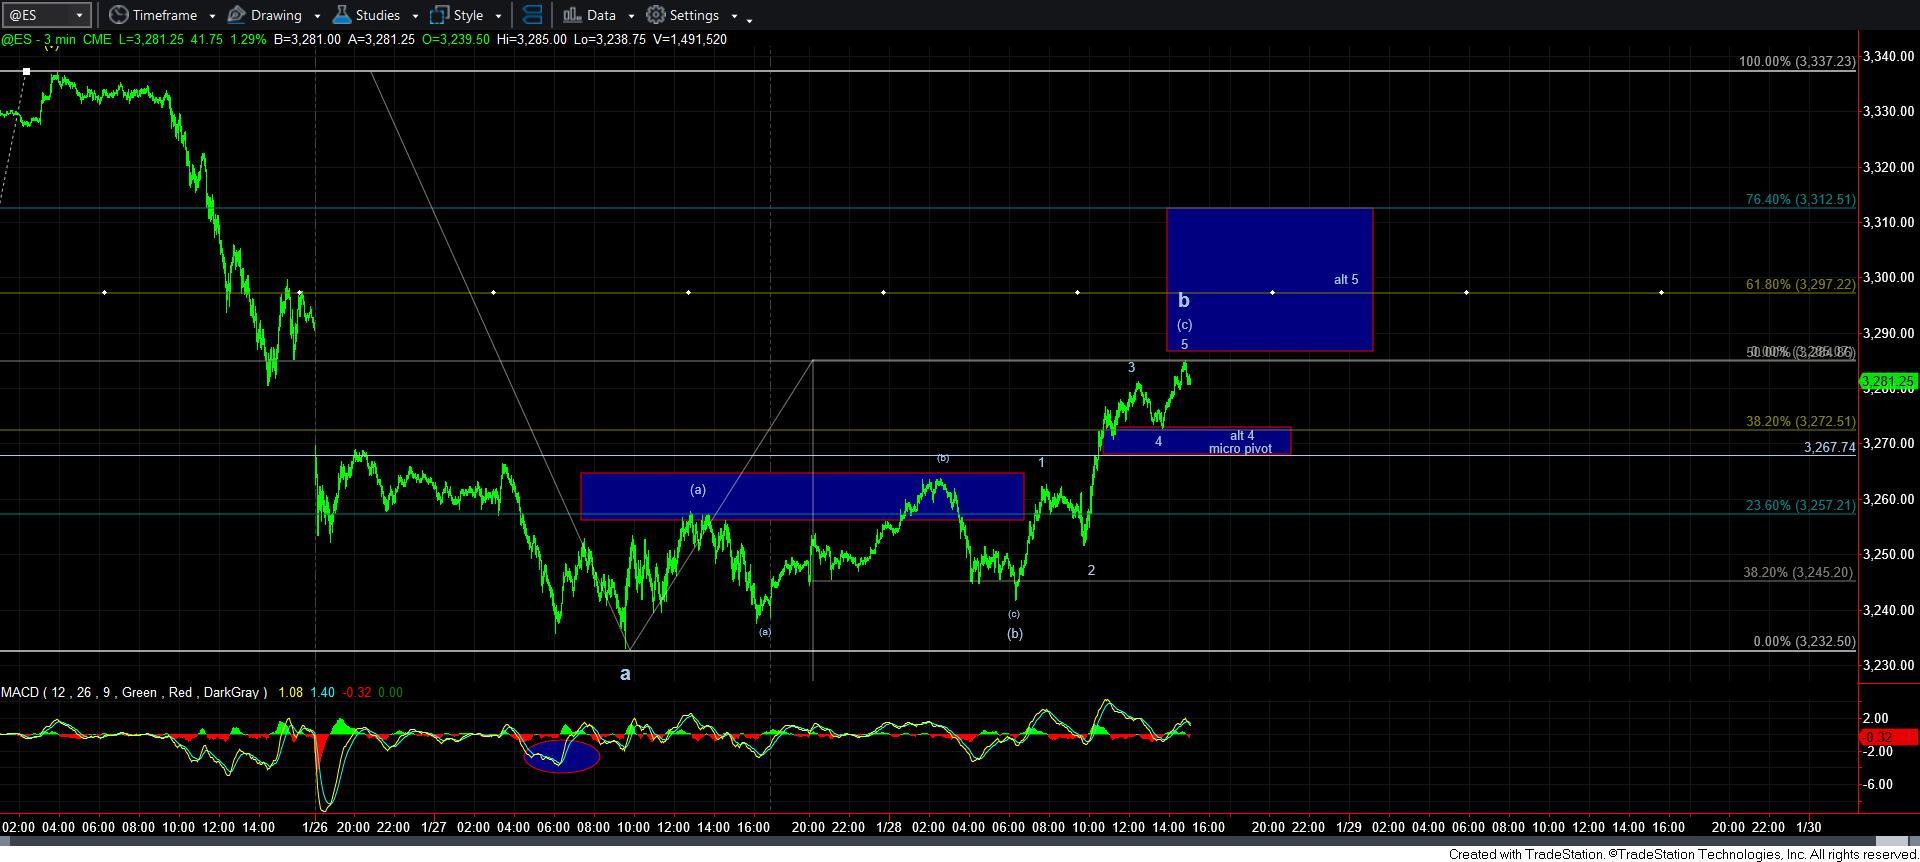
Within that count, I have been harping on the 3338SPX region due to the multiple points of confluence identified through various wave degrees. That is the region at which a wave [3] of iii would ideally target. And, last week, the market topped at the 3337.77SPX level. This led us to view the market as entering a wave [4] of iii.
As I highlighted over the weekend, the a-wave of that wave [4] has an ideal target in the 3225SPX region. And, this week, we hit a low within 8 points of that target.
Since that time, we have rallied in a corrective [a][b][c] fashion, which is almost complete in filling in the b-wave within wave [4]. And as I warn so often, b-waves take various twists and turns as they meander through their completion.
Overnight, the market rallied up to our lower resistance region in 3-waves, and then dropped down in a 5-wave structure into the low we struck this morning. Off that low, we rallied in a smaller degree 5-wave structure. So, I sent out an alert pointing to the potential of us having started the [c] wave rally a bit earlier than I had initially expected. I provided parameters for this rally, and the market fulfilled the rally as I outlined it early this morning.
As I write this update, we have the minimum numbers of waves in place to consider the b-wave as completed. Yet, we have only struck the .500 retracement of the drop off the 3338SPX region high. So, in order for the market to provide us with initial confirmation that the b-wave top has been struck, we will need to see a break down below the micro pivot between 3267-72ES in an impulsive fashion.
Remember, we are looking for a c-wave down in wave [4]. And, since c-waves are most often standard impulsive 5-wave structures, I would like to see an initial 5 wave structure take us down below that micro pivot to be more certain we are heading down in the c-wave of wave [4].
The minimum target I would expect from a c-wave down (assuming we have already topped) is the 3180 region, wherein a=c. Of course, the market fills in the alt 4-5, then the minimum target would be just below the 3200SPX region. But, my ideal target still remains in the 3155SPX region for now, which would require an extension beyond the a=c. But, once we see 5 waves completing, I will not stand on ceremony if we are targeting something a bit higher than 3155SPX.
So, in summary, the market seems to be following an ideal structure thus far. And, once we see an impulsive decline break down below the 3267-72ES micro pivot, then I will be looking towards regions below 3200 to complete a c-wave decline. That will likely be a buying opportunity for a long trade, which, if we reach the ideal target for wave [5] of 3 in this yellow count, we will likely be targeting the 3700-3800SPX region. And, I will be constantly adjusting our support regions so we can attempt to trade that in a safer manner.
Lastly, it still takes a break down below 3100SPX to make me view this more bullish potential as much less likely.