Completing A (b) Wave
As of yesterday’s update, my expectation was and still remains that we are “likely” working on a [b] wave within a larger degree pullback in the market. However, I am still going to retain an open mind regarding the green count presented on the 5-minute chart.
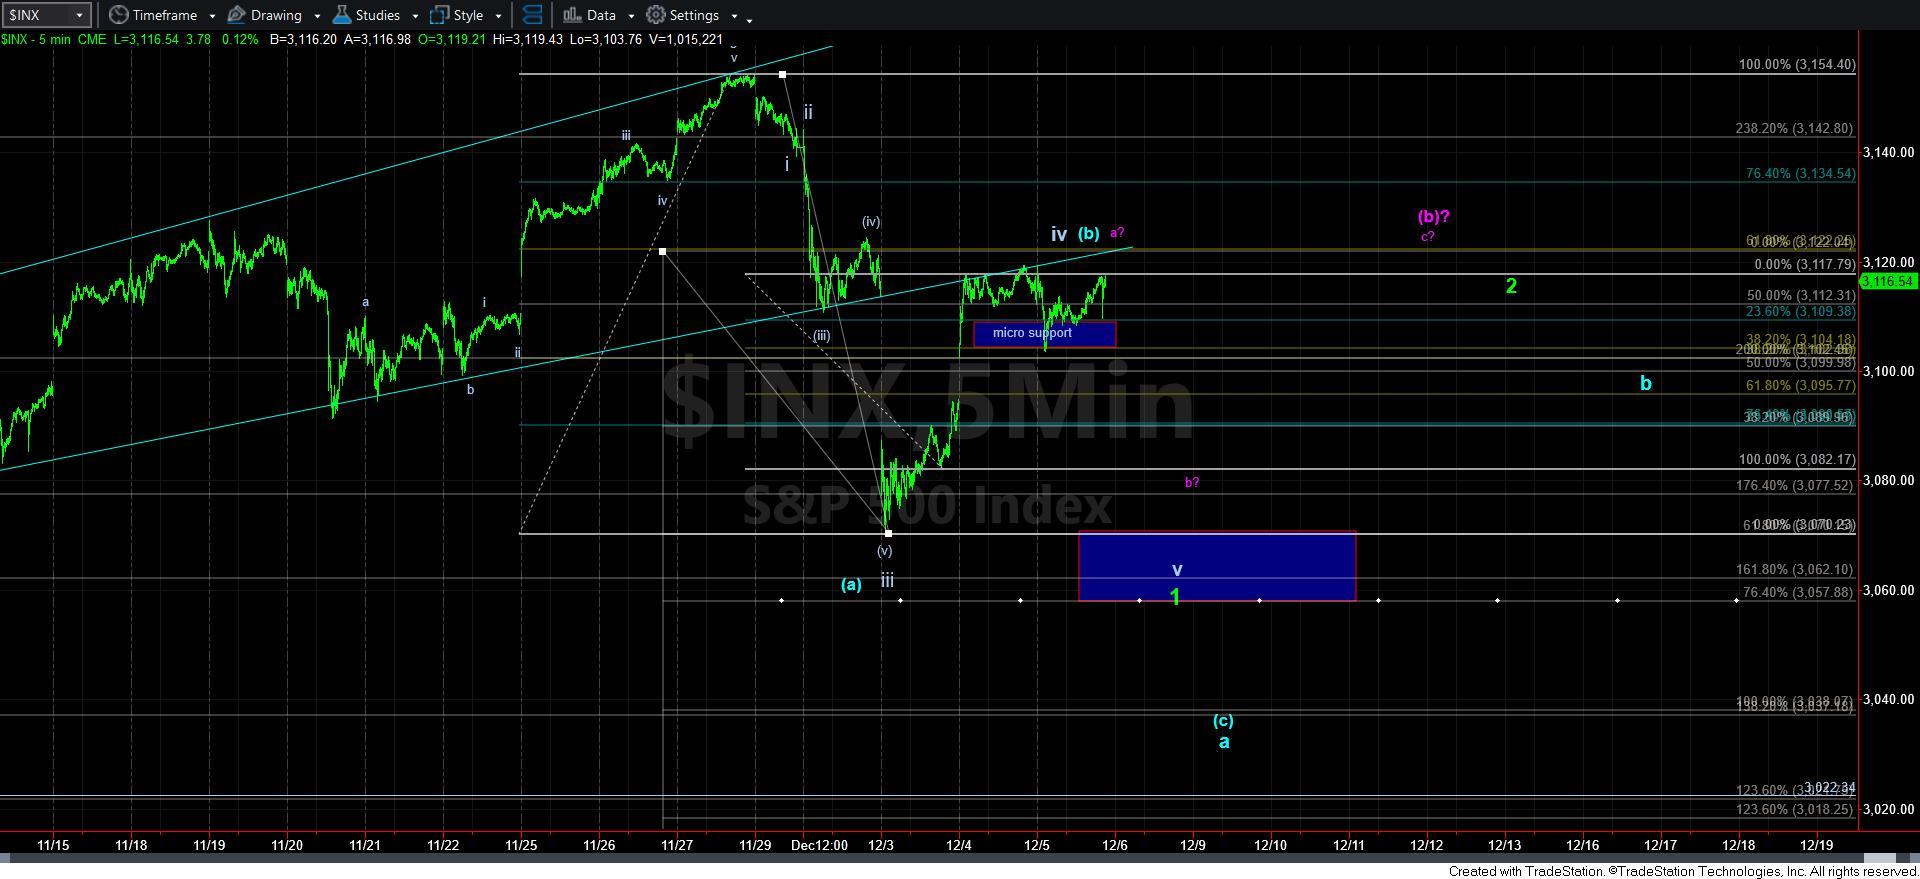
As far as the micro structure, when a [b] wave tops, we look for a 5-wave decline off the potential high to signal that a [c] wave decline has begun. The decline this morning failed to complete 5 waves down, which left us with the potential that we can push higher one more time, especially since we were not able to break down below the upper micro support noted on our 5-minute chart.
However, due to the structure within the market, I am now questioning whether we are indeed ready to begin that [c] wave down in blue. In fact, if we are unable to make a higher high in the SPX, then the next decline may only be a b-wave within a more protracted [b] wave, as presented in purple.
(As an aside, I want to remind you that the blue and purple counts will be exactly the same until we rally up towards the 3200 region in early 2020, at which time they will diverge and let us know which is the applicable count for 2020).
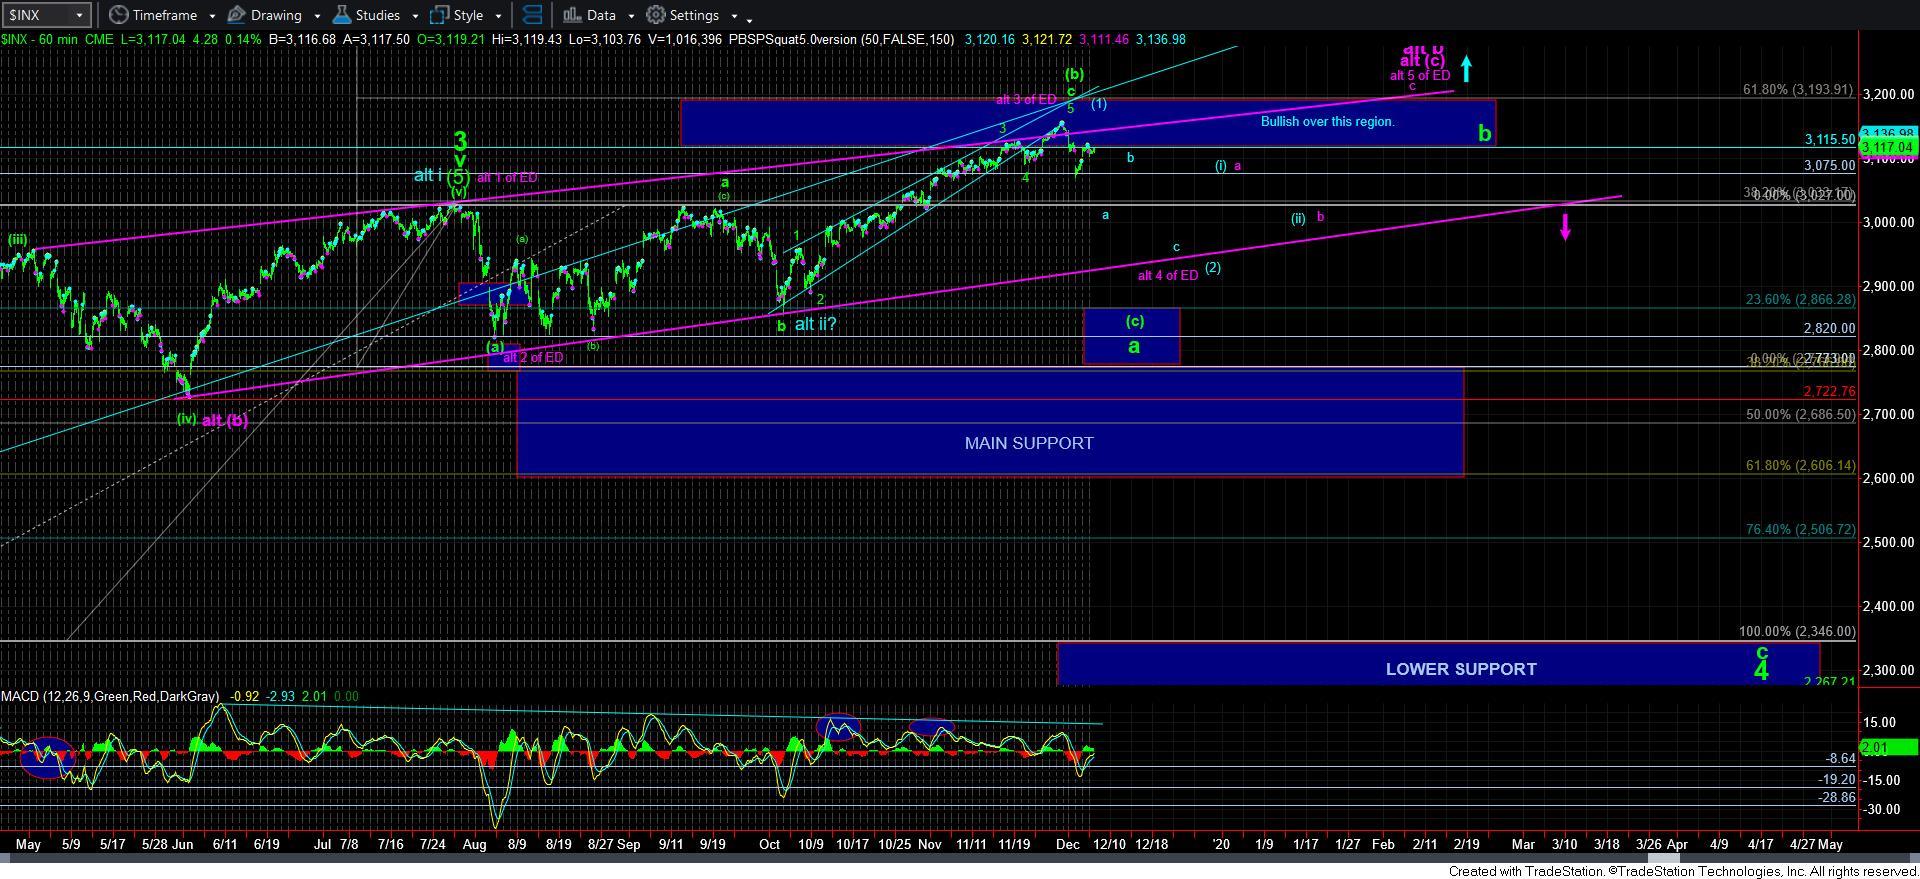
In the bigger picture, I think we are still only working on the a-wave of a larger a-b-c pullback, as you can see from the 60-minute chart. Again, this is assuming that we are dealing with the blue/purple counts. Should the market prove otherwise with a clearer indication that the green count is going to remain the preferred count, we should know within the next few days.