Coming Up A Bit High
As we were expecting a 4th wave bounce, the height of the move today is a bit unusual.
You see, after we strike a 1.618 extension for a 3rd wave, the market move often returns to the 1.00 extension in a 4th wave bounce. However, when we move through the 1.00 extension, it does warn that something else may be playing out.
With the market moving through the 3310SPX level, we have moved through the standard target I would expect in this wave degree, so I am now on high alert for a potential twist the market may be providing to us. And, that twist could very well be the ending diagonal pattern we have been worried about since we have moved down in an overlapping fashion from the b-wave high.
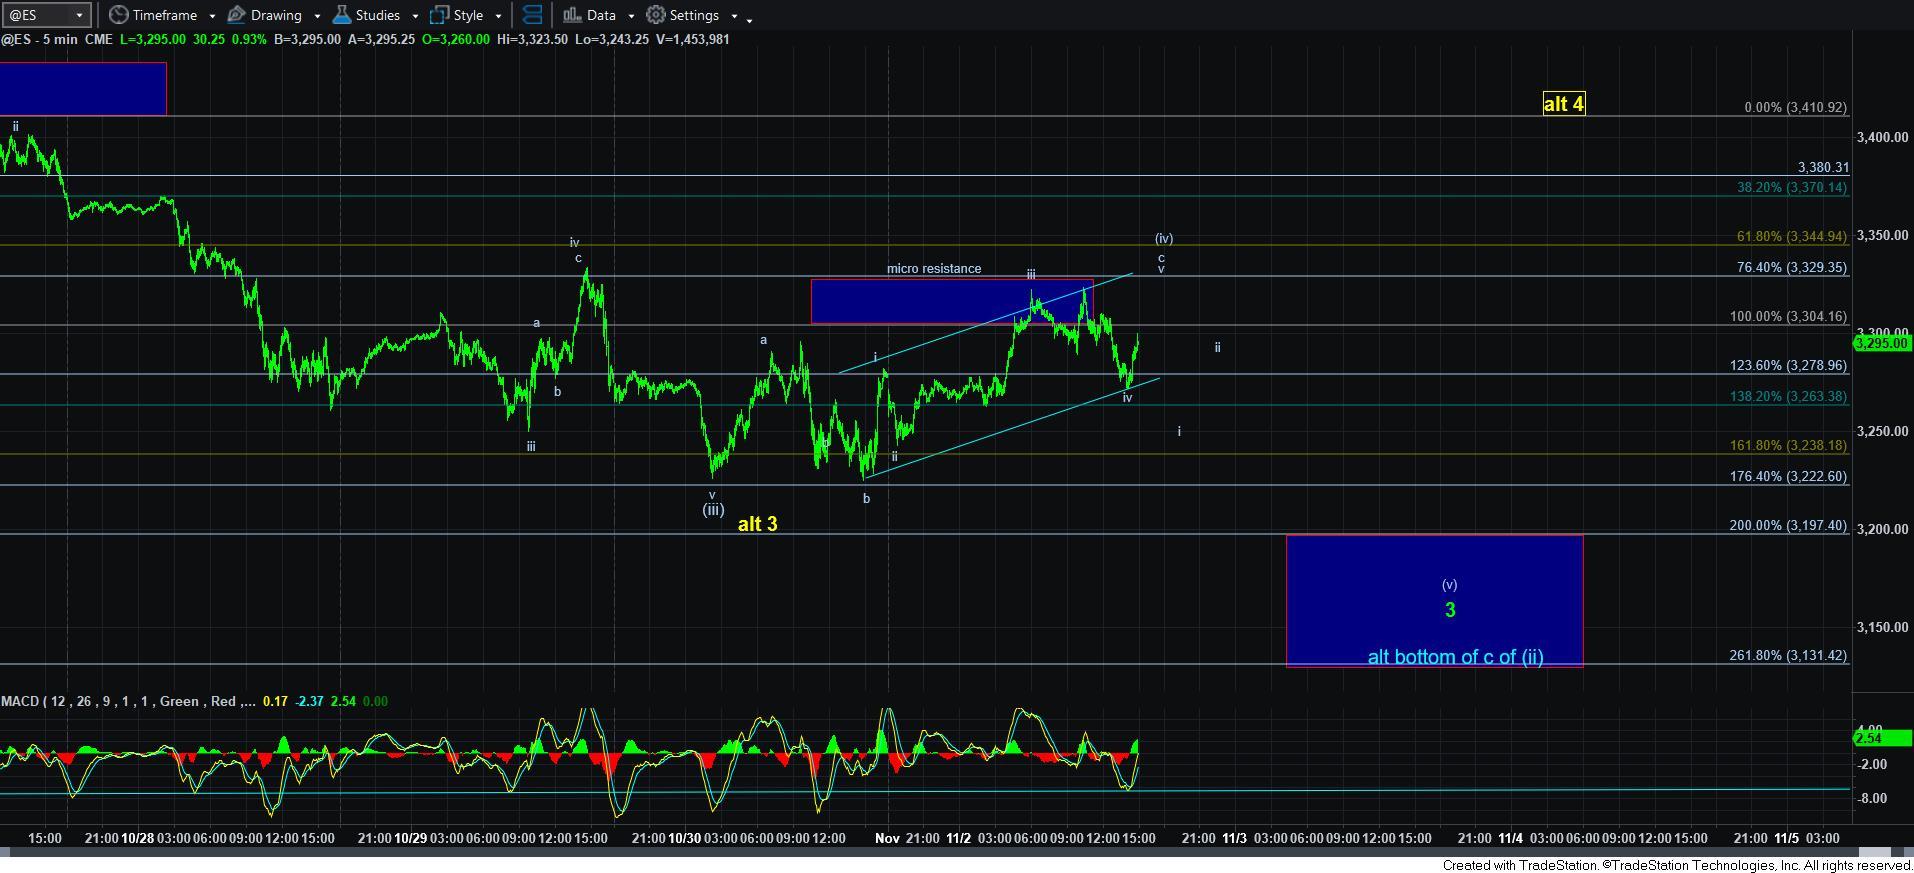
In the micro structure presented on the 5-minute ES chart, we really need a 5-wave decline to suggest we have begun wave [v] of 3. However, thus far, we only have 3 waves down as of my writing this update. So, we would need at least another lower low to suggest that we have begun a wave [v] of 3 down, and even that would be as a leading diagonal for wave i of [v] of 3, even if we get it.
However, if we hold the intra-day low, then I see potential for testing the 3330ES region for a more appropriate c-wave ending diagonal for wave [iv]. But, again, the fact we have come up this high is an early warning sign that we may see more of a complex structure taking shape.
Now, if we see a sustained break out over the 3330ES region, then it certainly opens the door to a more protracted structure taking shape as shown in the yellow count.
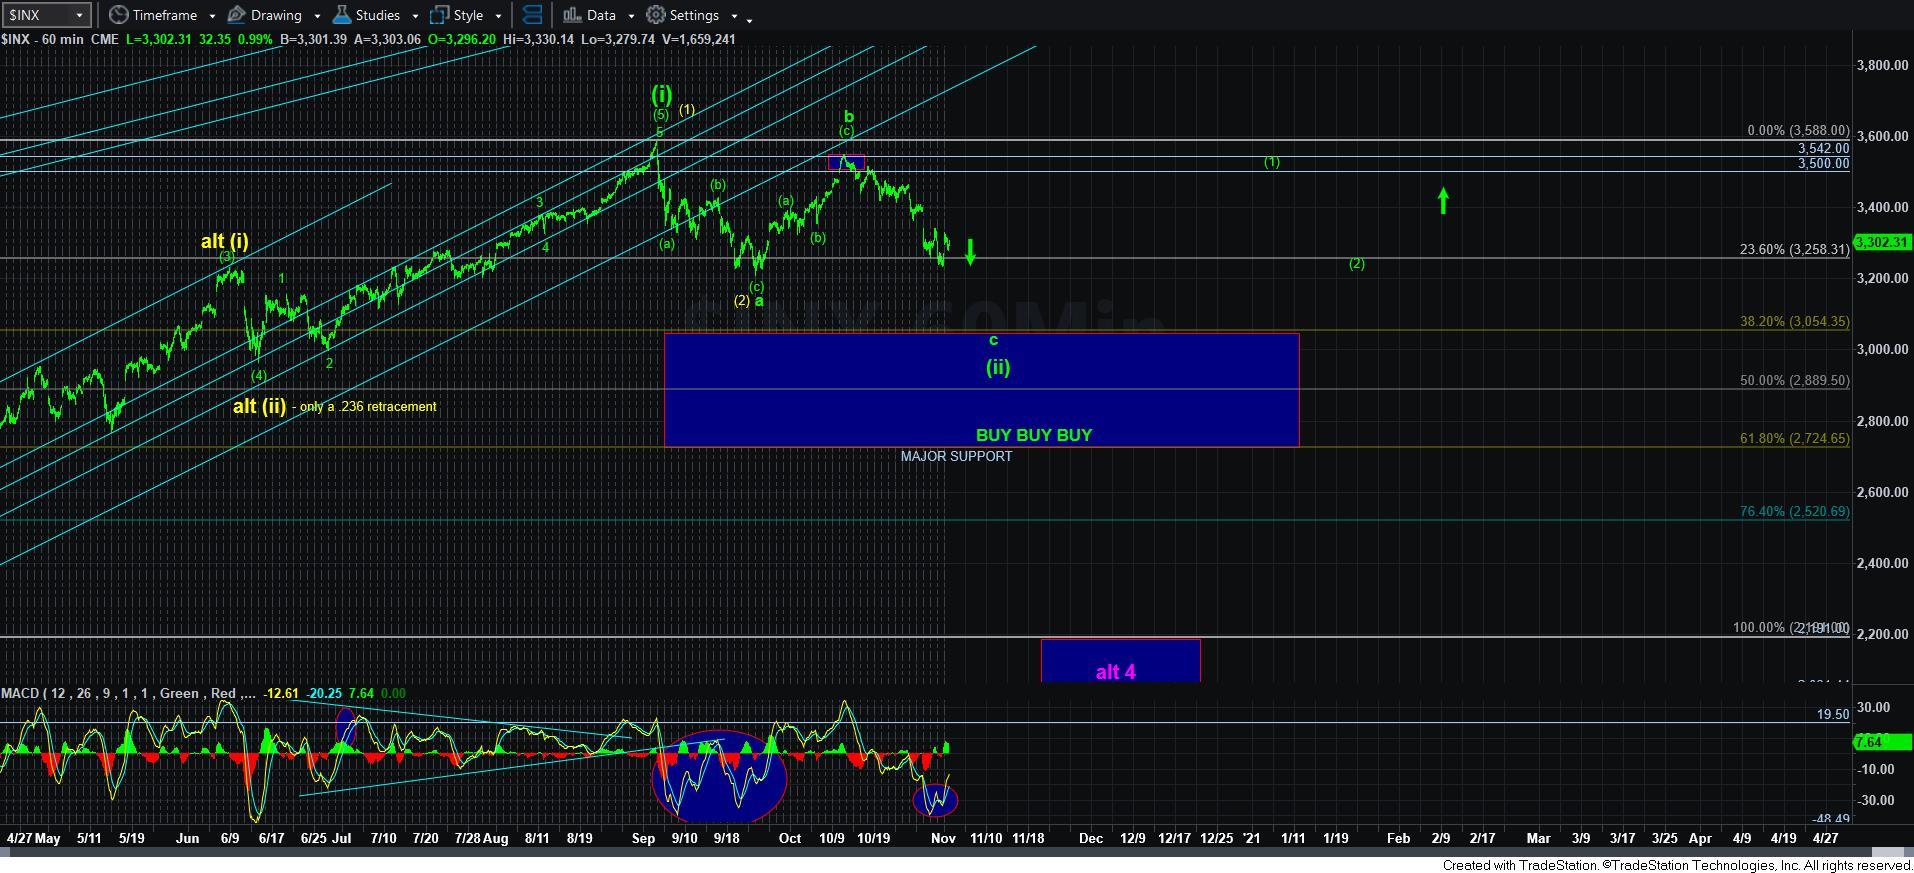
So, at this point in time, I still think we will see lower levels in the market to complete this c-wave of wave [ii] in green, but the structure may turn much more complex before we see more downside follow through.
Unfortunately, the market is not making this terribly easy, but I still think we will see further volatility. And, while I still think there are lower levels to be seen before this correction completes, please remain focused on the bigger picture, especially with the positive divergent set up we are seeing in the MACD on the 60-minute chart.
So, in the smaller degree time frame, watch the parameters outlined on the charts to know if we drop to our lower targets sooner rather than later, or if we have one more twist before we see those lower levels to complete this downside corrective structure.