Closing ON Support - Market Analysis for Feb 22nd, 2018
From a micro wave perspective, we had a wonderful day of catching all the twists and turns throughout the day. Yet, despite the downside set up presented by the market today, it has refused to break support just yet.
So, before I got into my smaller degree analysis, I want to repost something I posted this morning about the larger degree perspectives I maintain:
This is going to be a little complex, but I want to write out my thoughts to you and the potentials I am now seeing. There will be three potentials discussed in this write up, and I will likely reprint this in the evening update. Lastly, I will go through them based upon their degree of probabilities, as I see it right now.
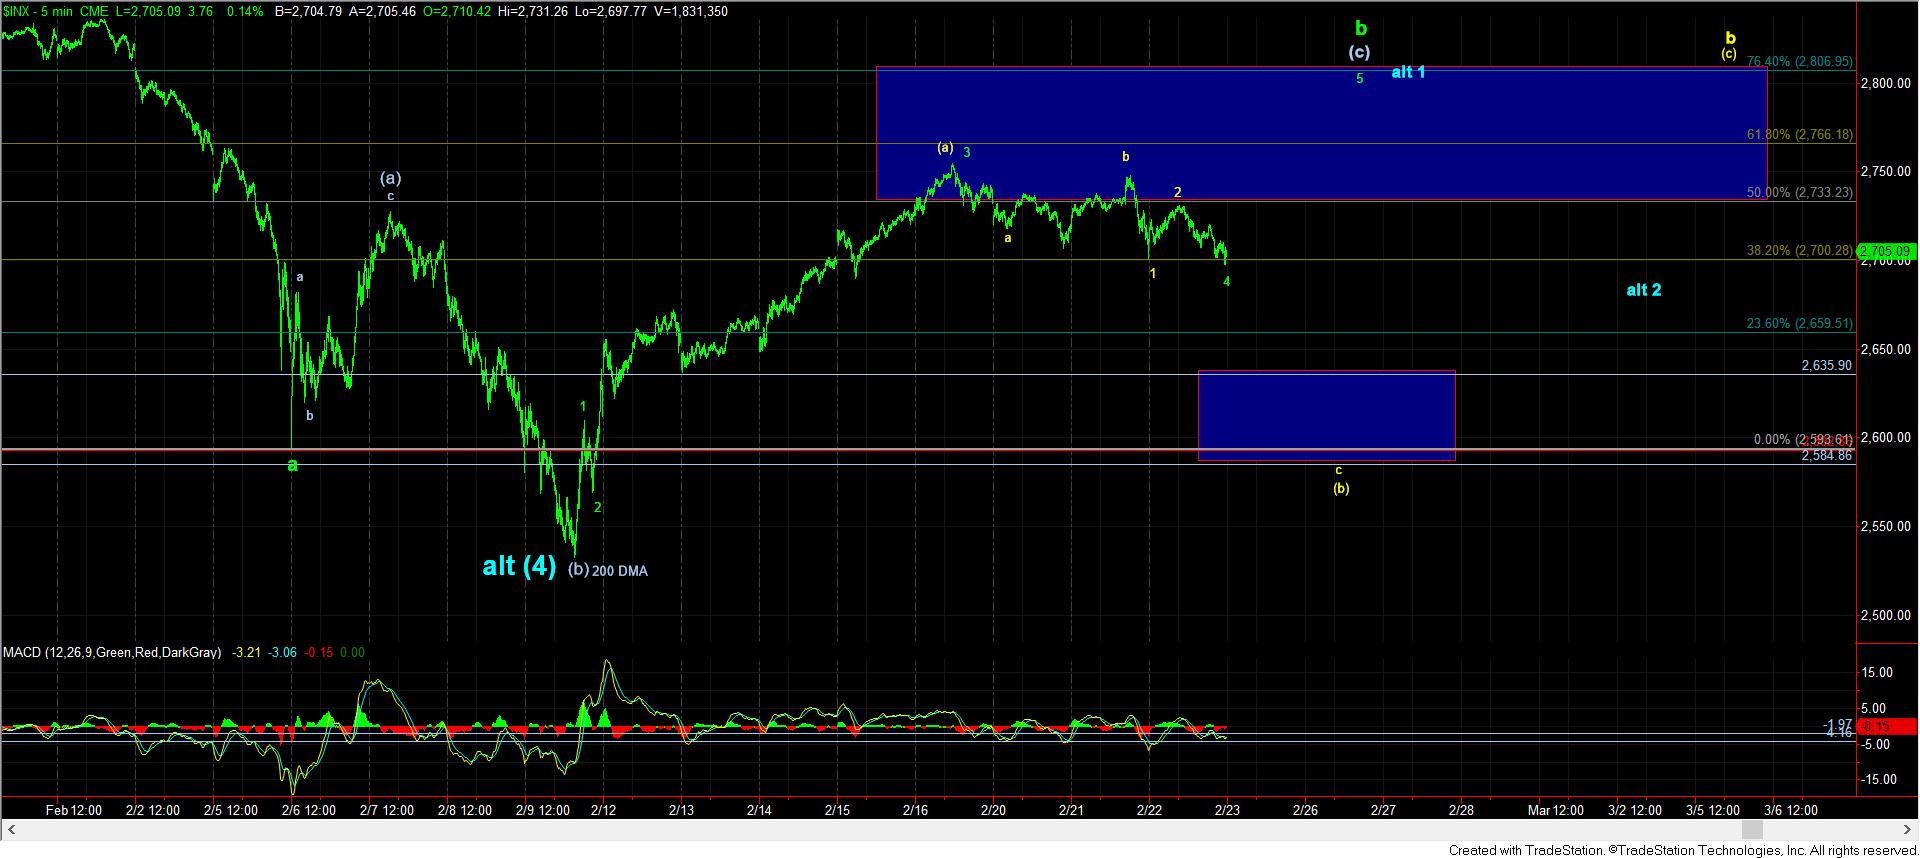
With yesterday’s drop, we now have 5 waves down in the market. My primary count, in yellow (not green) is that we are developing a more protracted b-wave structure over the coming weeks. That means that the drop yesterday was wave 1 of the c-wave in the (b) wave of b, as presented in yellow. The 5-minute ES chart presents the wave 2 retracement, which should not move higher than 2732ES. That would have us targeting the 2585-2600 region for the entire c-wave of (b) (2.00 extension of waves 1 and 2), which also provides confluence back up around the 2810SPX region if that 2585 region holds as support.
Should the market break out over the 2732ES, and continue over yesterday’s high, that would place me in the green count, which would be pointing directly lower in a c-wave (no protracted b-wave), and the target would be in the low 2400SPX region to complete all of wave (4).
IF we do move into the alternative b-wave count with a rally over yesterday’s high, MY ALTETRNATIVE AT THAT POINT and ONLY AN ALTERNATIVE at that point is presented in blue on the 5-minute SPX chart. That alternative would view all of wave (4) as completed, and that high in the 2770SPX region being wave 1 of wave (5). The way we will know to move into the alternative count at that point is if the drop off that region is corrective, and we then see a rally take us over the high we make in the 2770SPX region, which means that wave 3 of (5) is likely taking hold, and the entire wave (5) would be targeting a minimum of 3011.
Again, I have written these thoughts based upon my progression as I see the market as of right now. Please remember we are still PRIMALY within a 4th wave structure, and things may change. I have also outlined to you what would get me out of thinking this is still a 4th wave structure, but that will likely take weeks to confirm, which, at this time, is not my expectation.
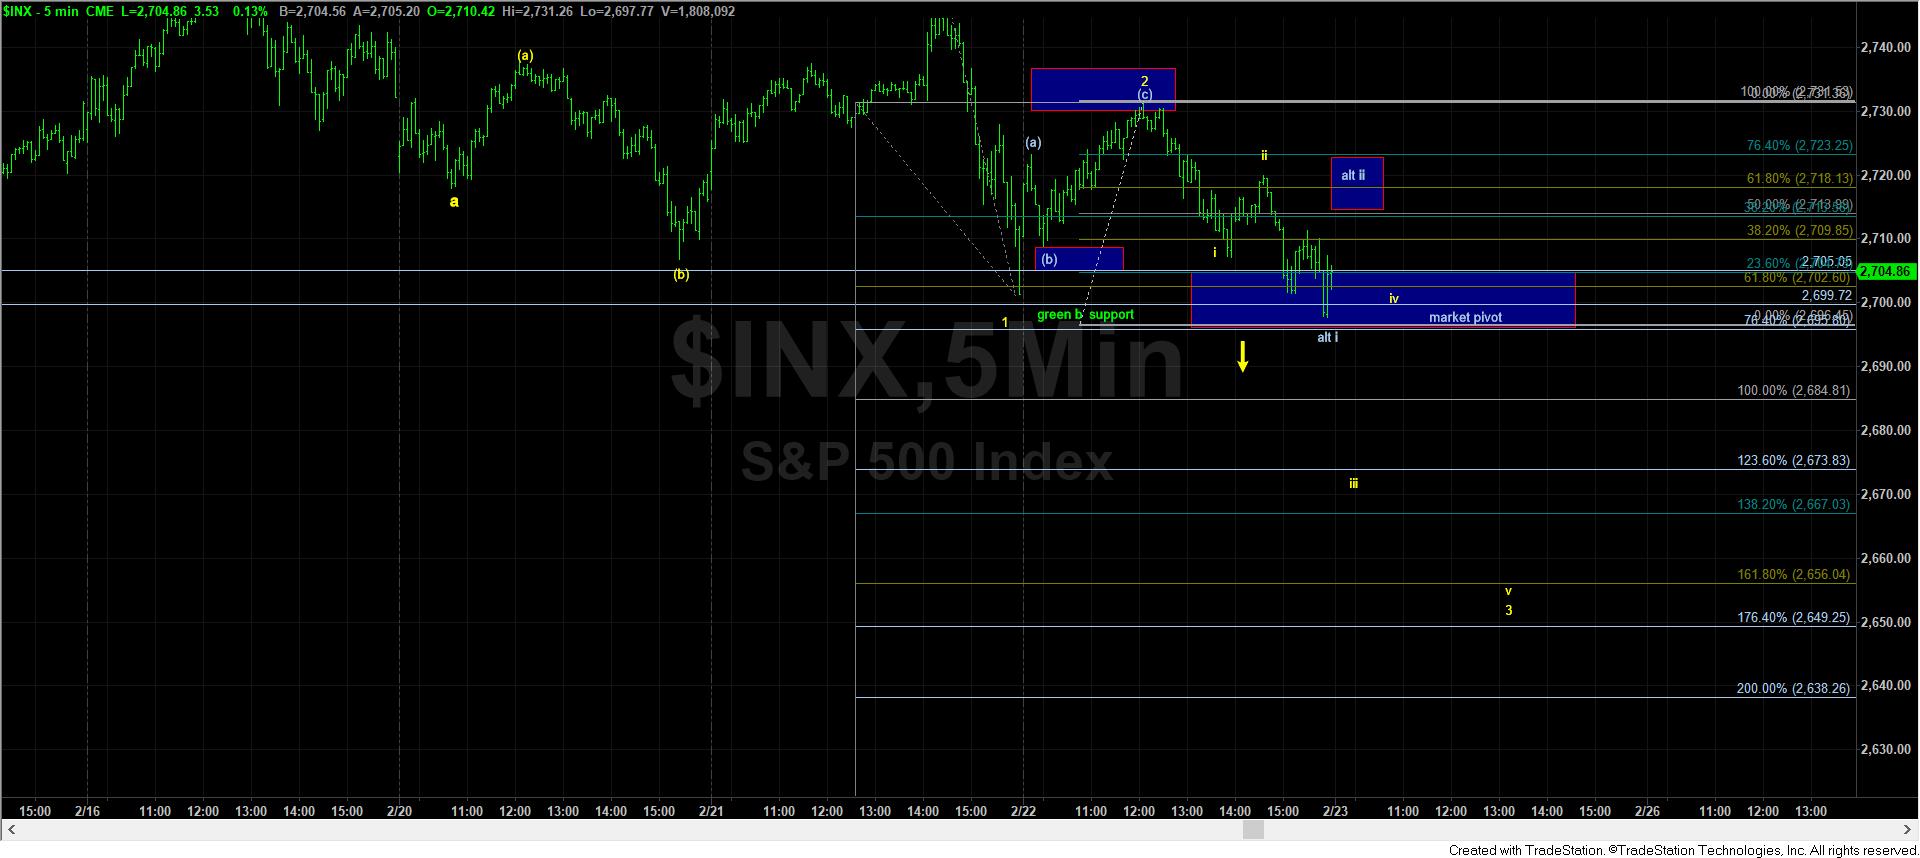
So, with the market maintaining below 2732 perfectly today, we have further downside structures that suggest the market can very well crack from this region. However, unless support actually breaks, we have no confirmation of the downside pattern, despite having a nice downside set up.
The SPX is going to have to break below 2695SPX without breaking back over the 2705SPX region to keep pressure down, as outlined in the yellow count on the zoomed-in 5 minute chart. If we see follow through in this structure in the next day or so, then we will likely be targeting at least the 2640SPX region, but, more preferably, the 2585-2600SPX region.
Alternatively, this region can still represent the green wave 4 noted on the larger 5-minute chart, and taking out today’s high would make that much more likely.
With the market closing right over support, it has certainly left us with a cliffhanger for tomorrow.