Clearly Heading Lower - Market Analysis for Dec 6th, 2022
It is clear today that the market wanted to take the direct path lower in the a-wave. Yet, the structure with which we developed this downside is not entirely clear to me. So, it forces me to track two separate paths. But, BOTH are still pointing us to our bigger pullback, which was clearly confirmed today with the break of various supports.
Overall, I am still counting this as an a-wave within the bigger retracement for the green [b] of yellow wave [2]. The question is how deep will it take us?
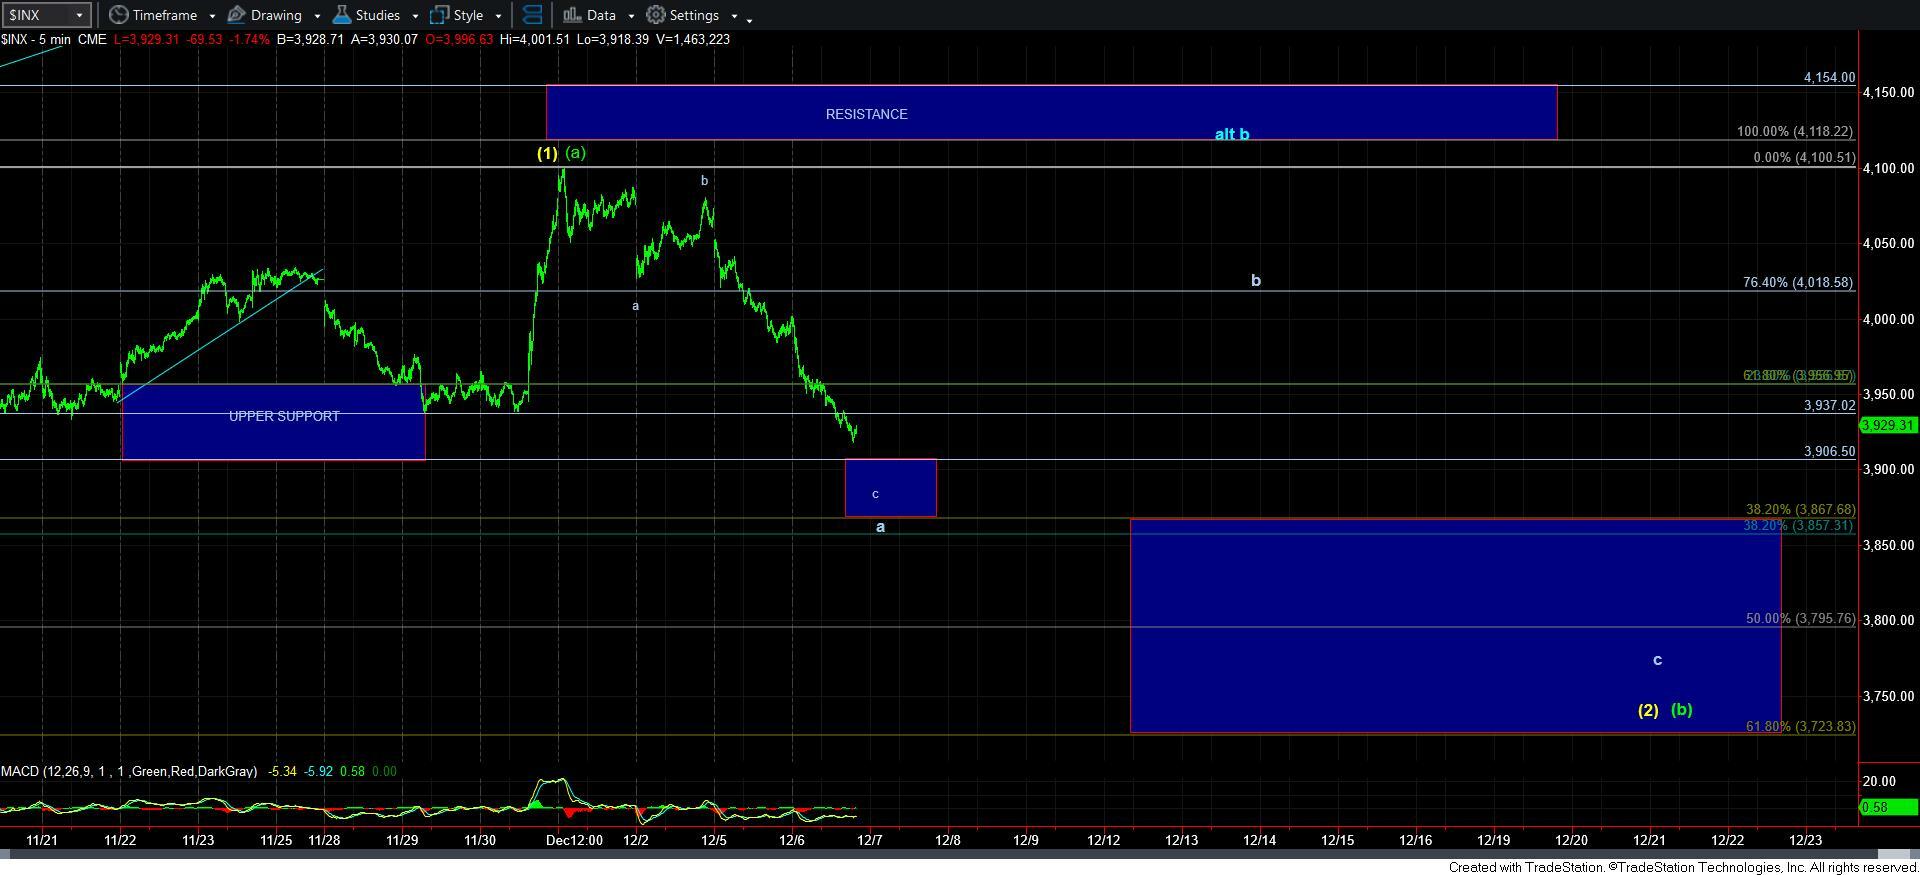
As I outlined yesterday, it is quite common to see the a-wave target the .382 retracement of the [a] wave rally. That points us down towards the 3867SPX region. But, we do have support starting from 3906SPX, which was the bottom of our prior “upper support region, as you can see from the 5-minute SPX chart.
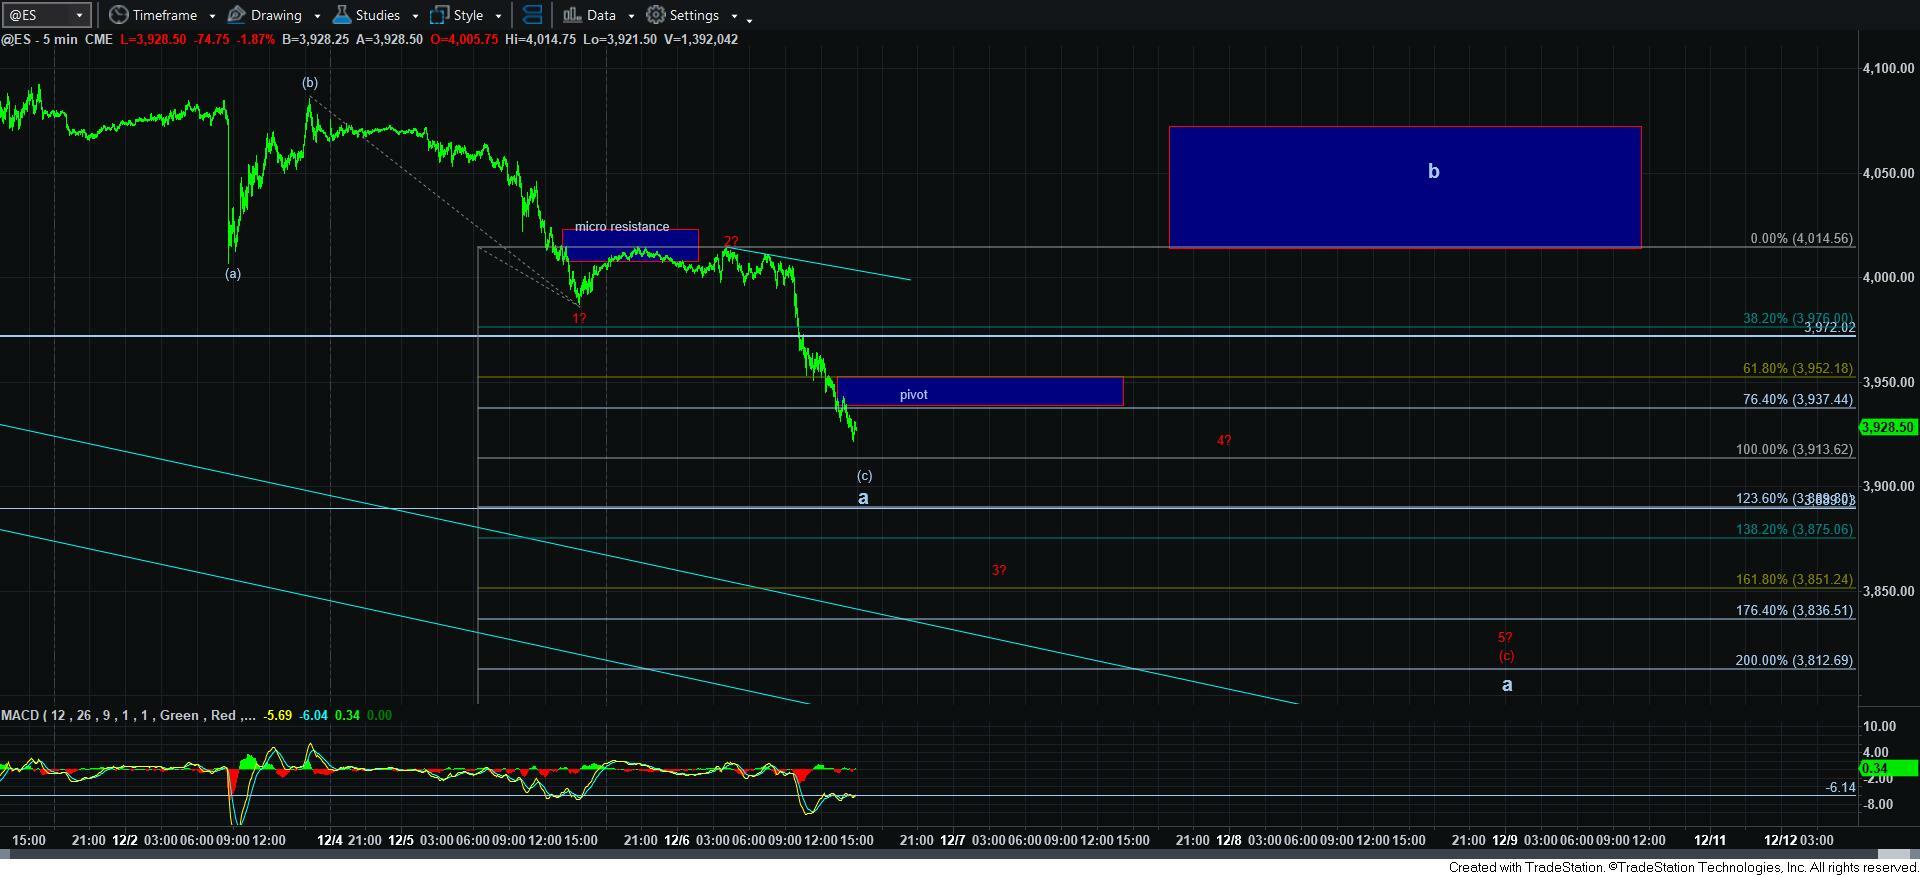
The other possible path I am considering is presented in red on the 5-minute ES chart. I am not at all enthralled with this count, as there are many issues with it. First, I struggle to get 5 waves down for wave 1. Second, the wave 2 is not even a .382 retracement. But, I have added a pivot to the chart, and if we are unable to break back out over the pivot, then I am going to have to keep this in consideration because pressure remains down as long we are below 3955ES. But, again, I am not enthralled by it.
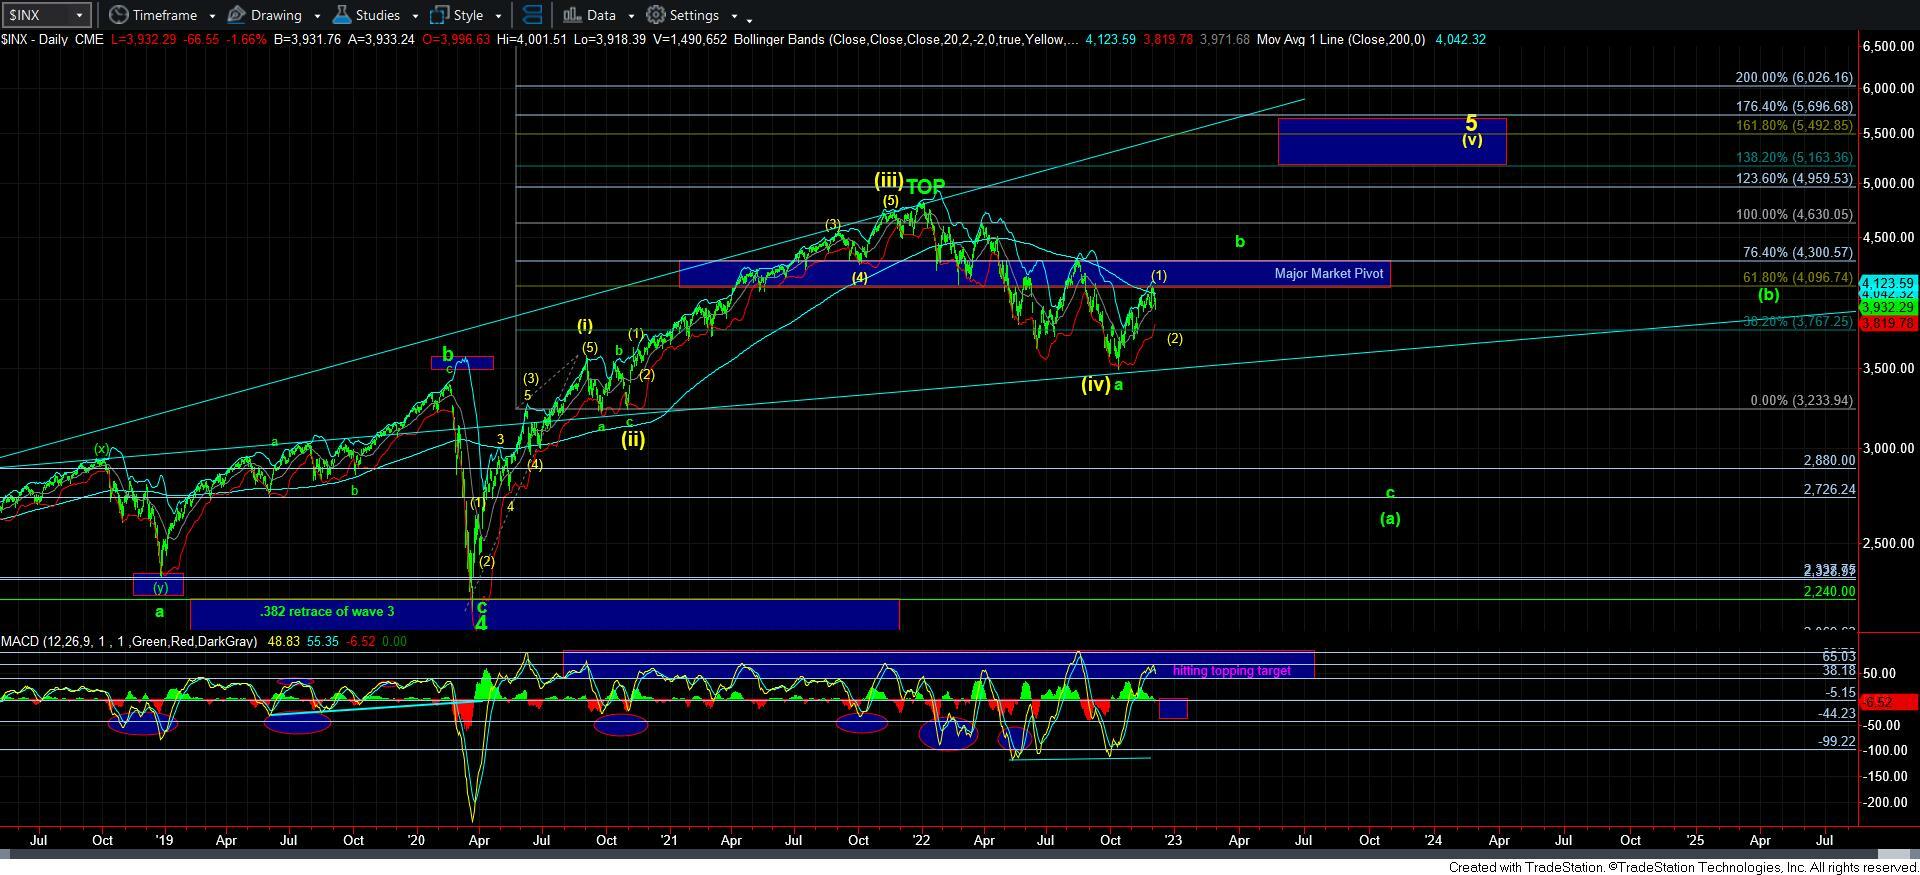
I want to point out that the daily MACD has finally begun to turn down and is supporting our current larger degree wave count. It still has a bit of room lower before we get to our target, but it has at least begun the process.
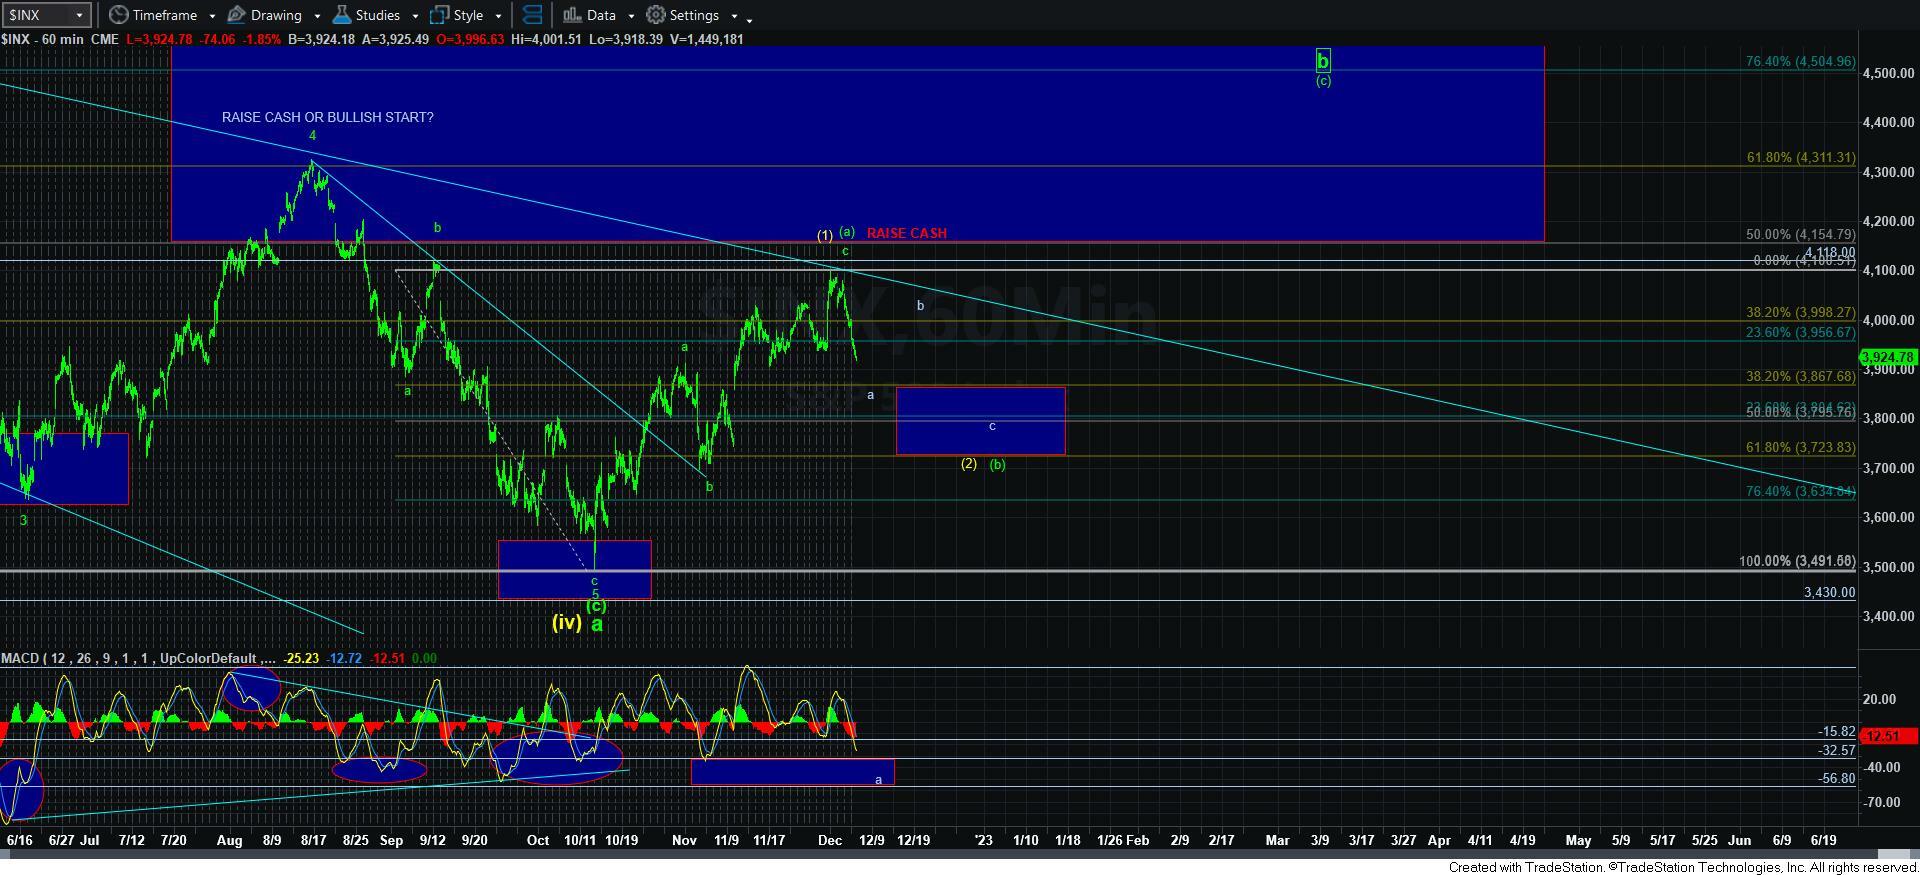
The other factor I want to point out is the 60-minute MACD is moving down into its target for the a-wave. Normally, we see a deep drop for the a-wave, and a bounce in the MACD for the b-wave. Therefore, I am going to assume that the b-wave can chop us around for a week or two before we are ready for the c-wave lower. The c-wave pushes the MACD lower again and often comes back down towards the region of the a-wave, and provides us with a positive divergence in the MACD relative to the lower low in prices in the SPX. This is a common set up for a long trade, and I will be watching for this quite intently.
As far as alternative counts go, well, when the market came up short of the ideal target for the [a] wave in the 4118-4154SPX region, I always kept that in the back of my mind. You see, it is quite common to see the b-wave come back and strike the ideal targets for which the prior rallies came up short. So, this is now my alternative count in blue, as noted in the alt-b count on the 5-minute SPX chart. But, take note, this is not a high probability, but it happens often enough that I wanted to point it out.
In summary, as I outlined in the weekend update, I expected we would know rather early in the week if we had indeed begun the pullback in the green [b] / yellow [2]. The market has now made it clear that it is quite likely we have begun that pullback. But, as I have noted, there is likely still a lot more work to be done before this completes. We still have to confirm a low in the a-wave, and thereafter we can set up targets and proposed paths for the b-wave. And, again, I would expect the b-wave to take us at least a week of upside chop, so, consider it will likely be a very whipsaw environment during such a b-wave, and many of you may not want to be trading during such an environment.