Clear Corrective Action - Market Analysis for Aug 22nd, 2016
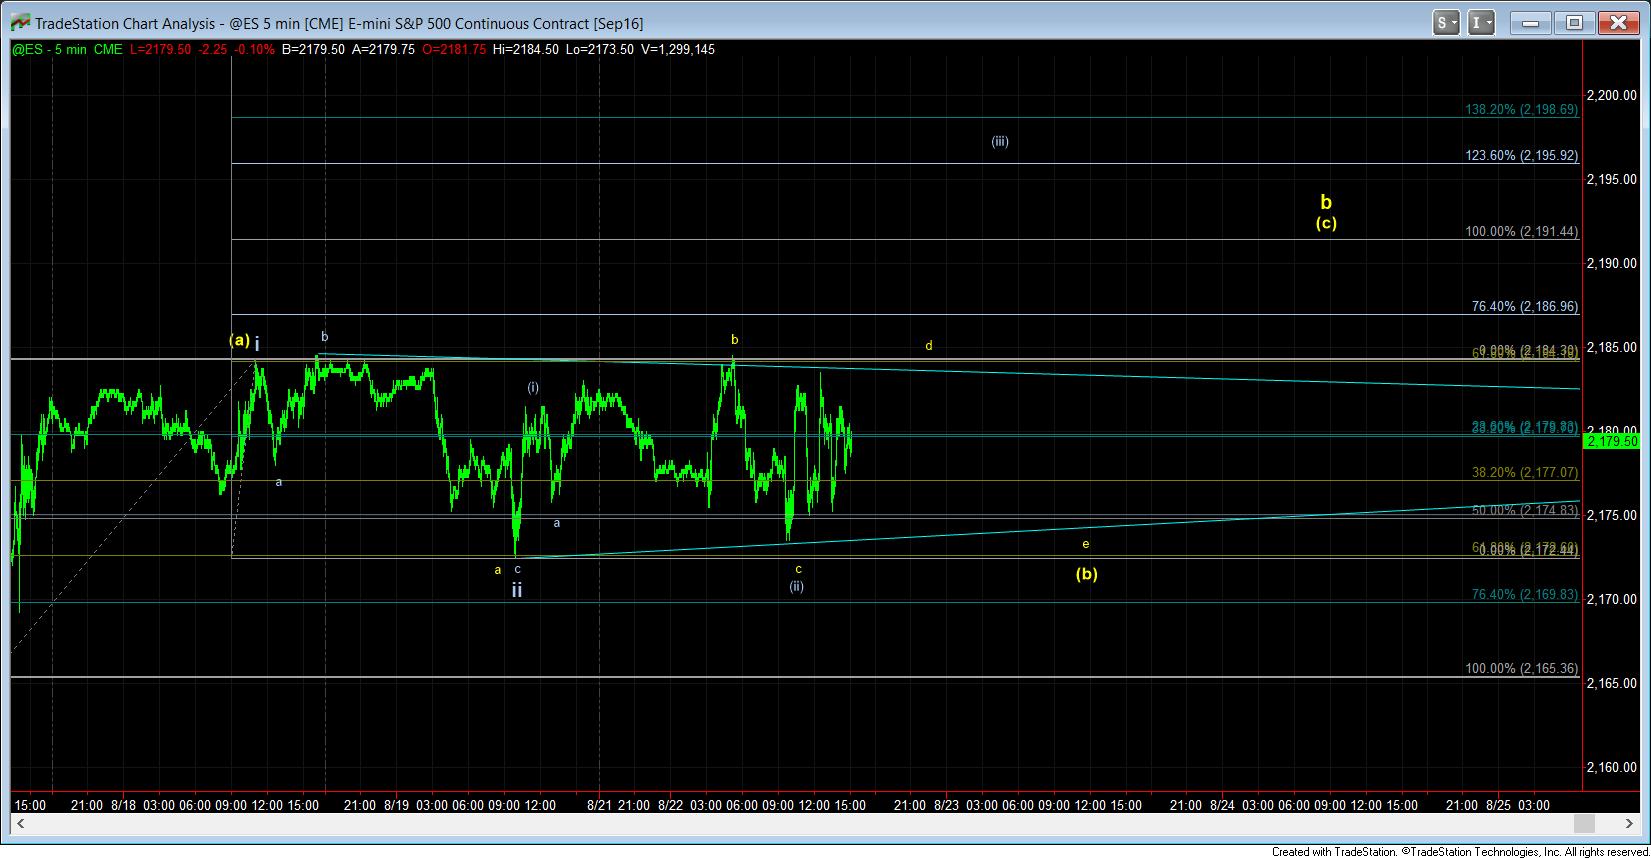
Today, we were mired in a sideways event. Often, those are indicative of triangles. So, assuming we are in a triangle, earlier today, I put out an update showing that we may be in a b-wave triangle. That triangle would still set us up for a move higher towards our resistance zone, but it would likely only be as an expanded b-wave top. That would then set us up to drop again in a c-wave to the downside.
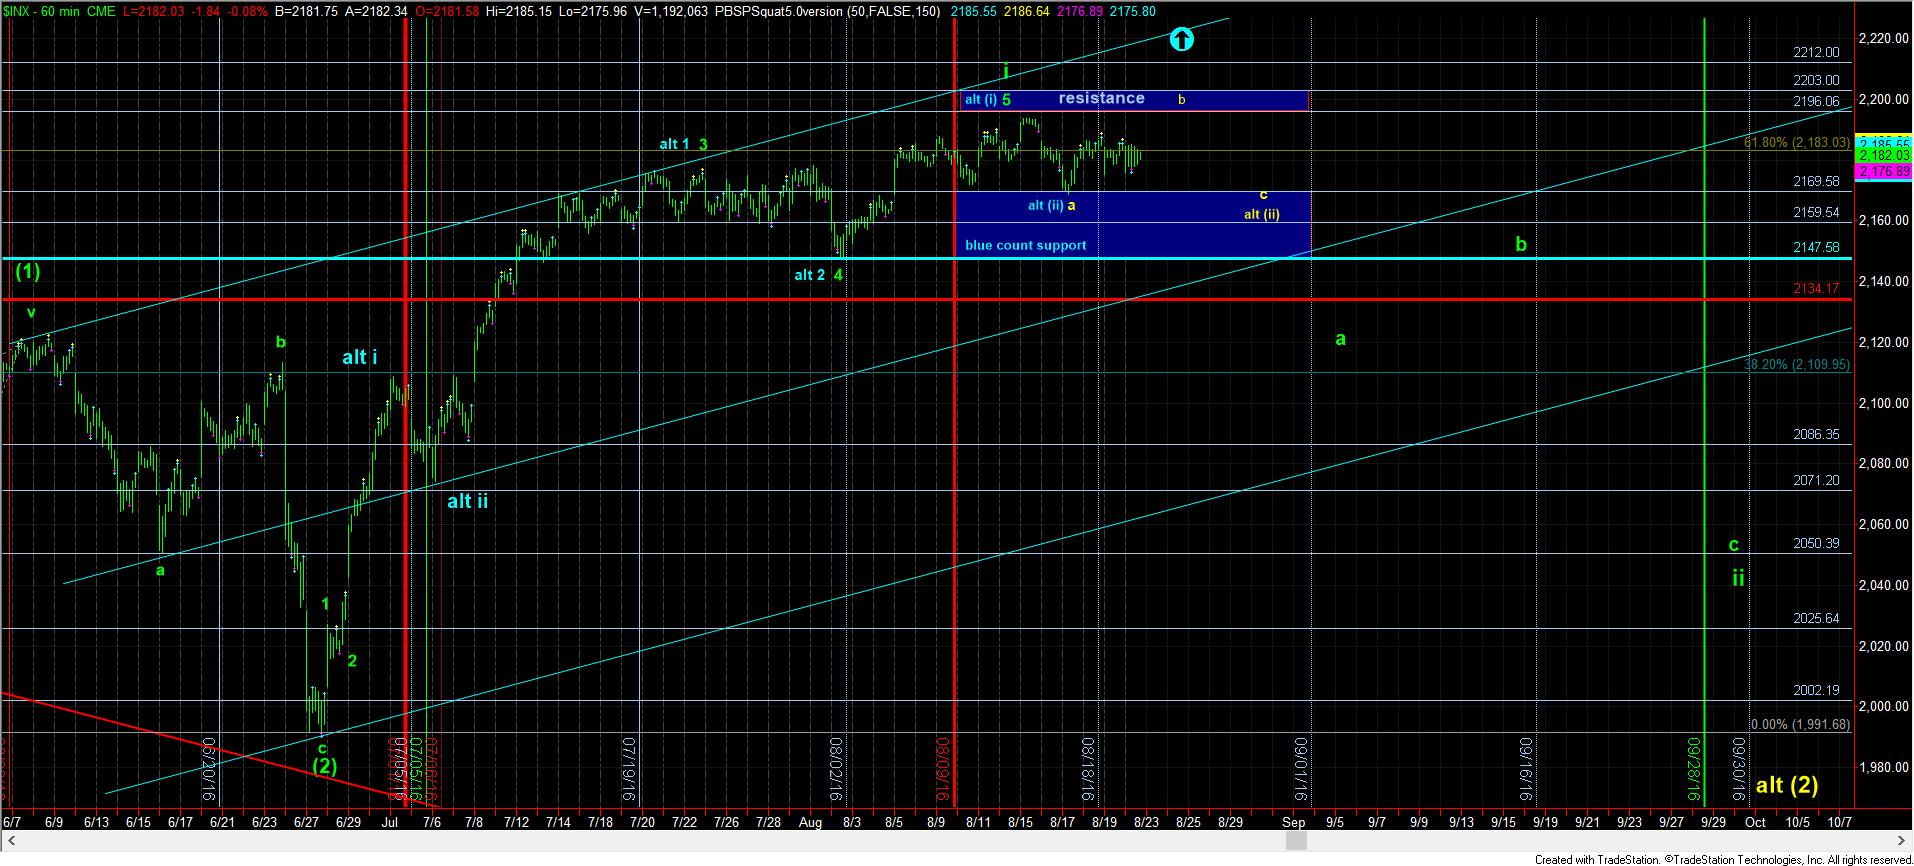
Now, even though I have labeled that count in yellow, it can be operative for either count. As you can see, it can be an alternative for the wave (ii) count – which is effectively the blue count, or it can only be part of the initial corrective action in the larger degree a-wave of the green wave ii count.
The important part of seeing a triangle in here is that it makes is less likely that the market is ready to break out directly in the blue count, even if it does test the resistance region again. While seeing a strong move through resistance will make me reconsider that perspective, seeing a triangle complete in this region will significantly reduce the probability of that potential. So, at least today’s boring action has given us some clues as to where we reside in the overall pattern.
Also, please recognize that corrective action is highly variable and not easily trackable. For this reason, I want to warn anyone who is attempting to trade this pattern potential I have placed on the chart to not do so aggressively. These are known to morph so I would caution against any aggressive action being taken on these small degree corrective moves.