Certainly “Feels” Bullish - Market Analysis for Mar 13th, 2019
The stock market certainly has a way of making investors feel bullish and often at the wrong times. As we get closer and closer to the ideal target for this b-wave rally we have had on our charts for many months, the price action is stirring what seems to be extreme emotions, and almost all of them are bullish right now.
But, I have to still warn everyone to be cautious. As I have mentioned so many times before, since the market is made up of stocks, our StockWaves analysts have told me that the great majority of the stocks they follow are still very much within that overlapping b-wave structure.
Moreover, Luke Miller, who runs our Bayesian service (which analyzes options pricing to determine probabilistic market direction) had his computers calculate the probabilities of this being a b-wave at 70%. His specific words to me were that it “looks bad under the hood.”
Now, since we know that life is not certain, we have to make decisions based upon the weight of evidence. And, while our emotions are making us “feel” bullish, the weight of evidence still supports this being a b-wave rally. And, interestingly, these emotions are getting stronger and stronger as we get closer and closer to that ideal target overhead.
So, while we may see some reasons to look for a bullish resolution to the action up here, the weight of evidence still suggests that this is a b-wave rally. And, until structure, underlying stocks, and Bayesian probabilities suggest the weight of evidence shifts towards a bullish outcome, I have to go with the math rather than the emotions.
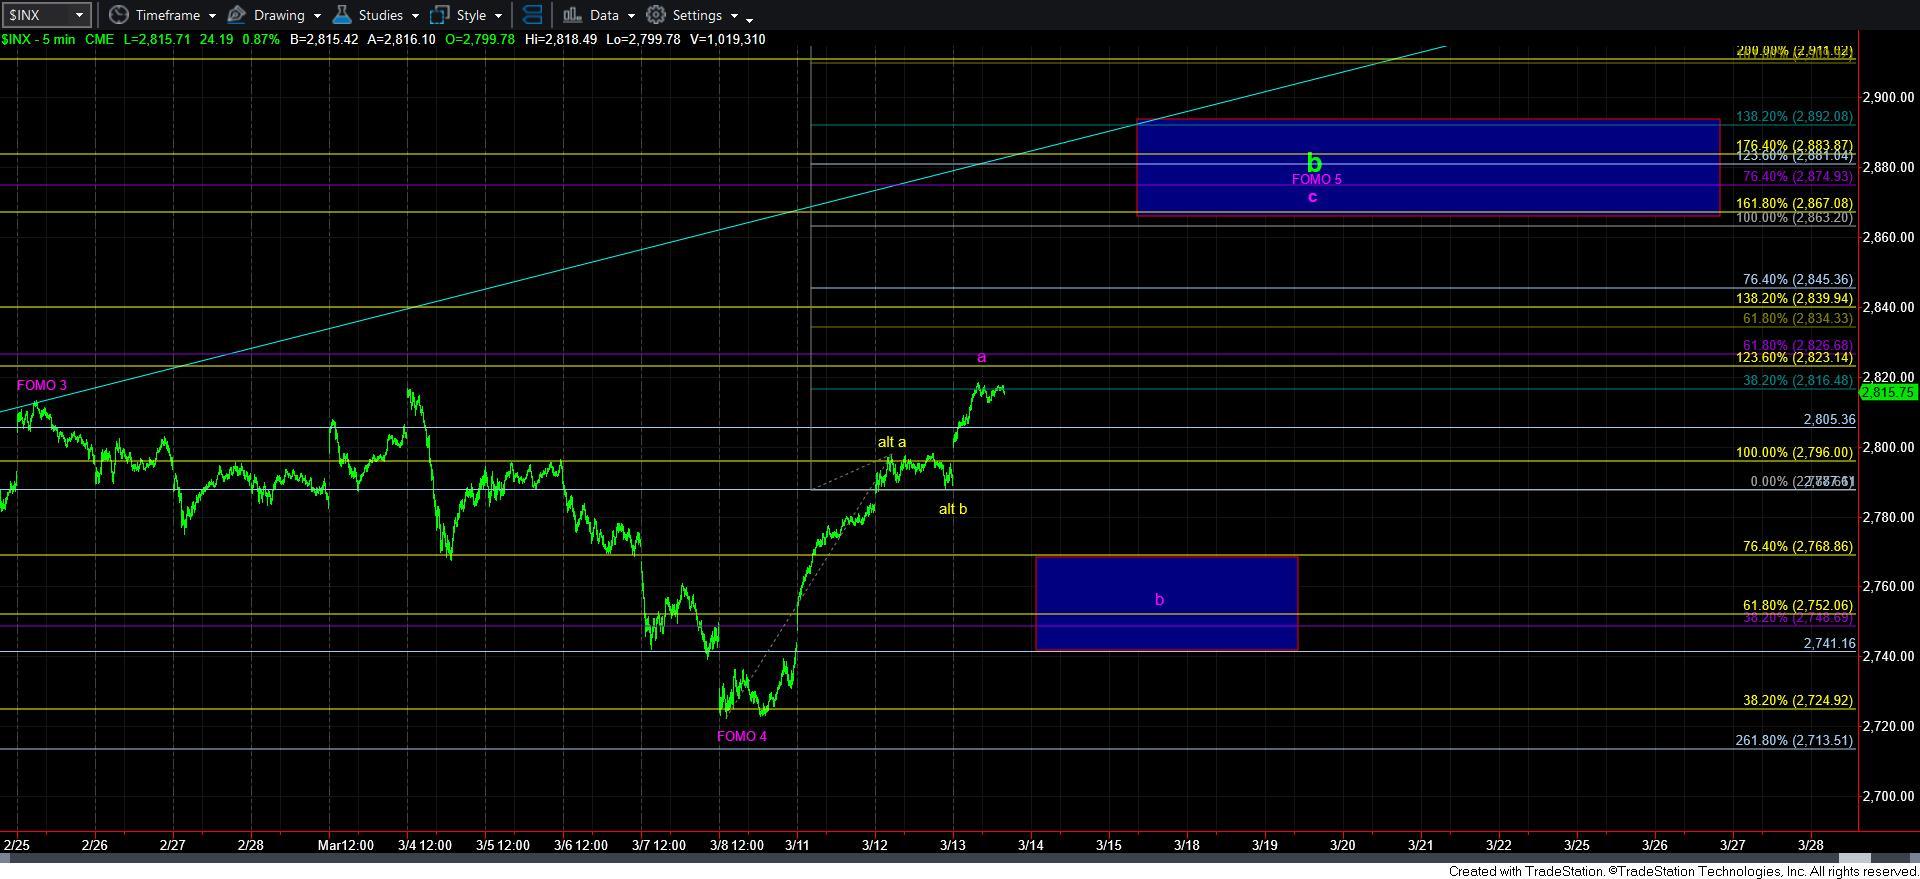
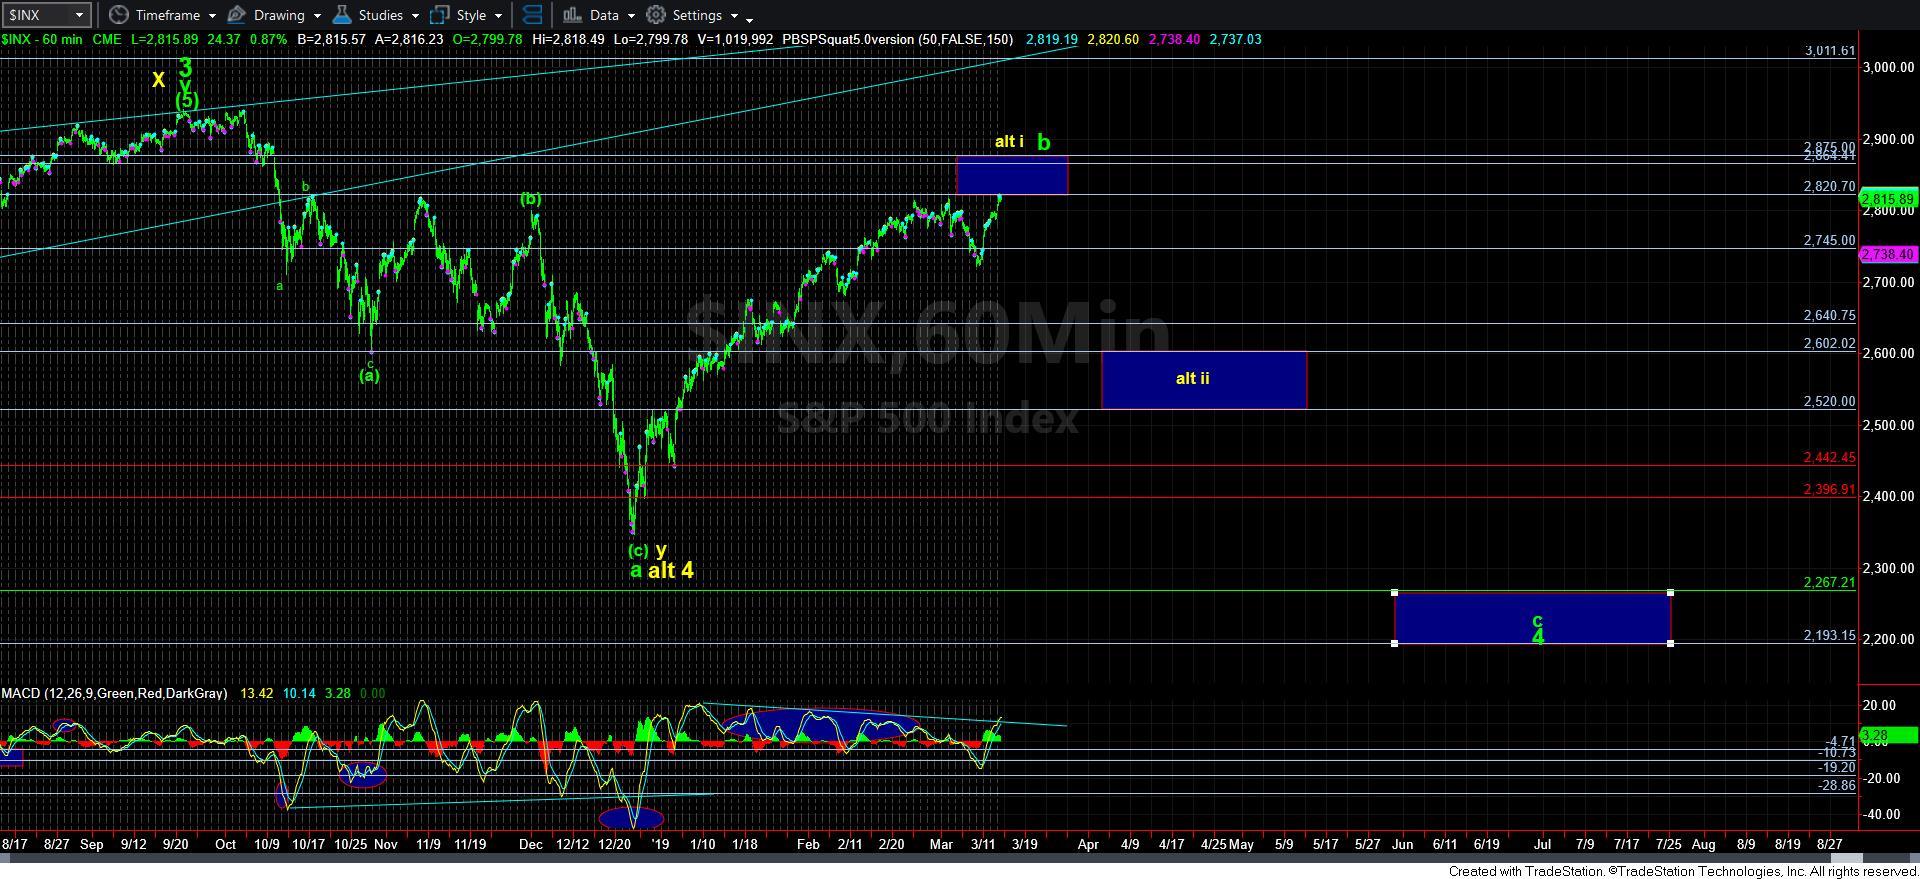
In the smaller degree structure within this 5th wave, I am uncertain if the market is going to take a direct path to the target overhead (yellow path on the 5-minute chart), or if we can still see that b-wave pullback. Since the market has not really provided for much in b-wave pullbacks during this entire rally, it may choose to do so once again, and take us directly up to our target rather than providing us with a standard b-wave pullback presented in purple. And, if we head up directly, we have an a=c target around 2865.
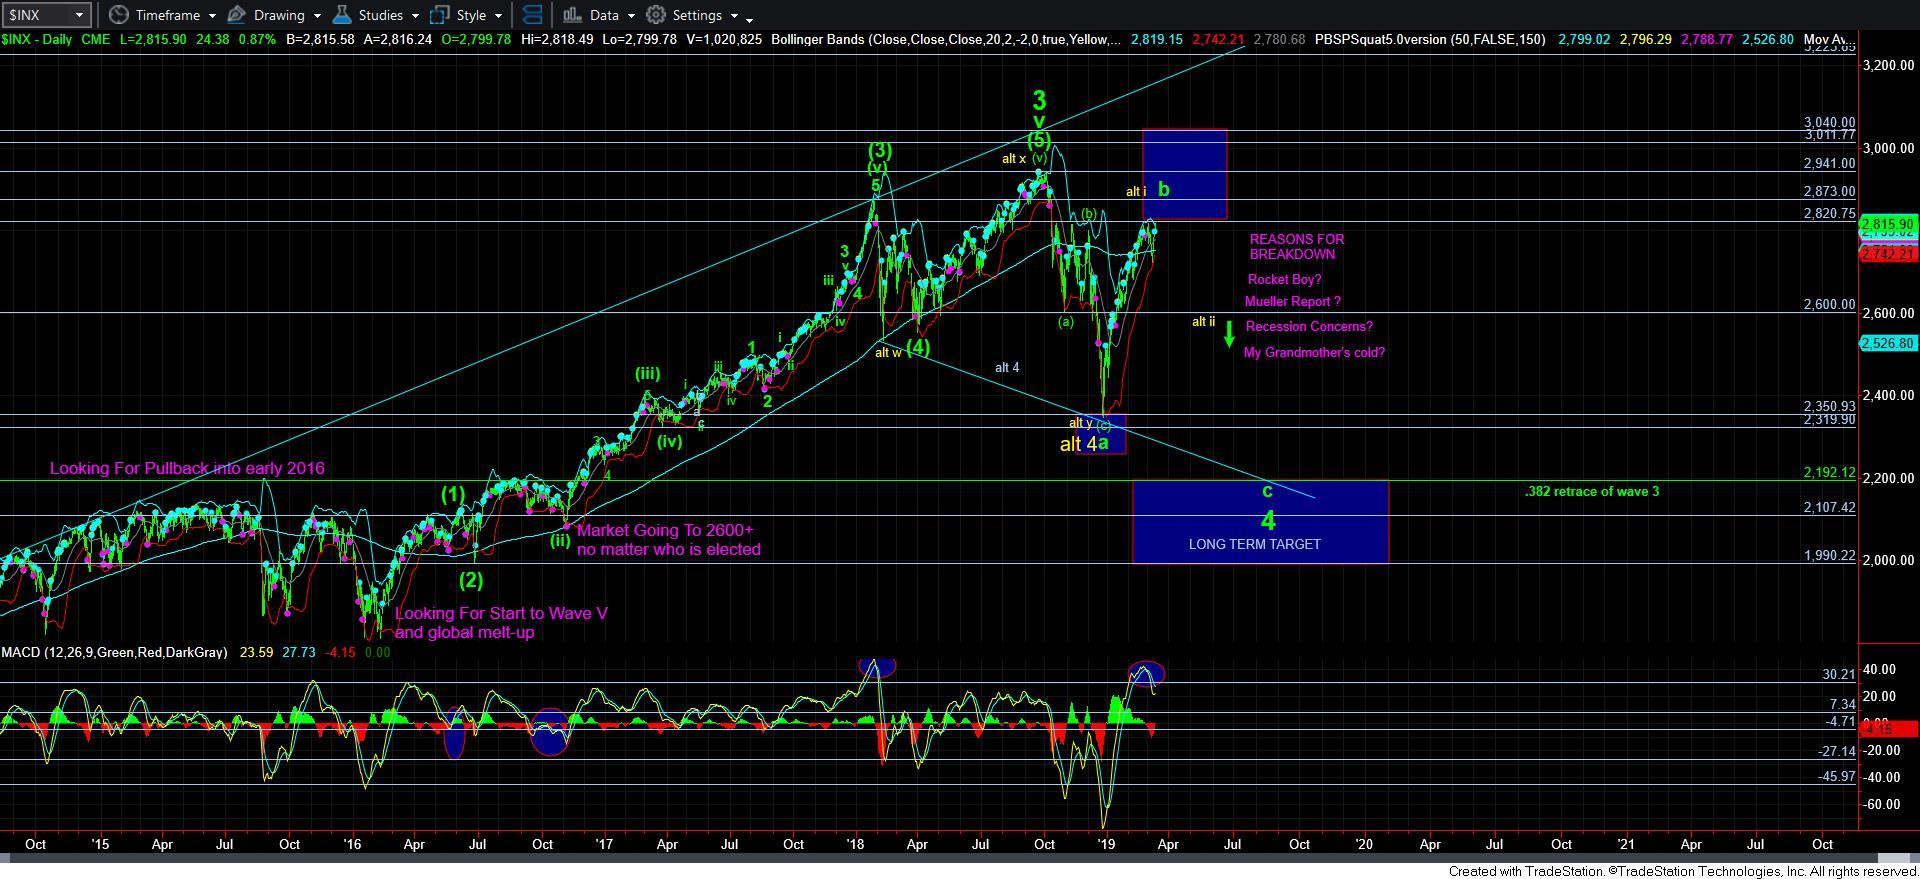
Overall, my expectations remain the same, and the weight of evidence suggests that this is a b-wave which will likely complete over the coming week or two. And, assuming the next decline begins with a 5-wave structure breaking down below 2720SPX and pointing us towards the 2640SPX region, then I will be confidently looking for the 2200SPX region. However, if the initial decline is corrective in nature, then I will have to much more strongly consider the yellow count, and be looking for potential buying opportunities, most specifically in stocks such what I presented regarding the AAPL analysis I highlighted in my live video this morning.