Catalyst Tomorrow - Market Analysis for Jul 11th, 2023
I am sure many of you realize that there is a CPI report tomorrow. And, many of you are probably going through the scenarios as everyone else in the market. However, I thought this would be a good time to remind you about how I view these types of catalyst.
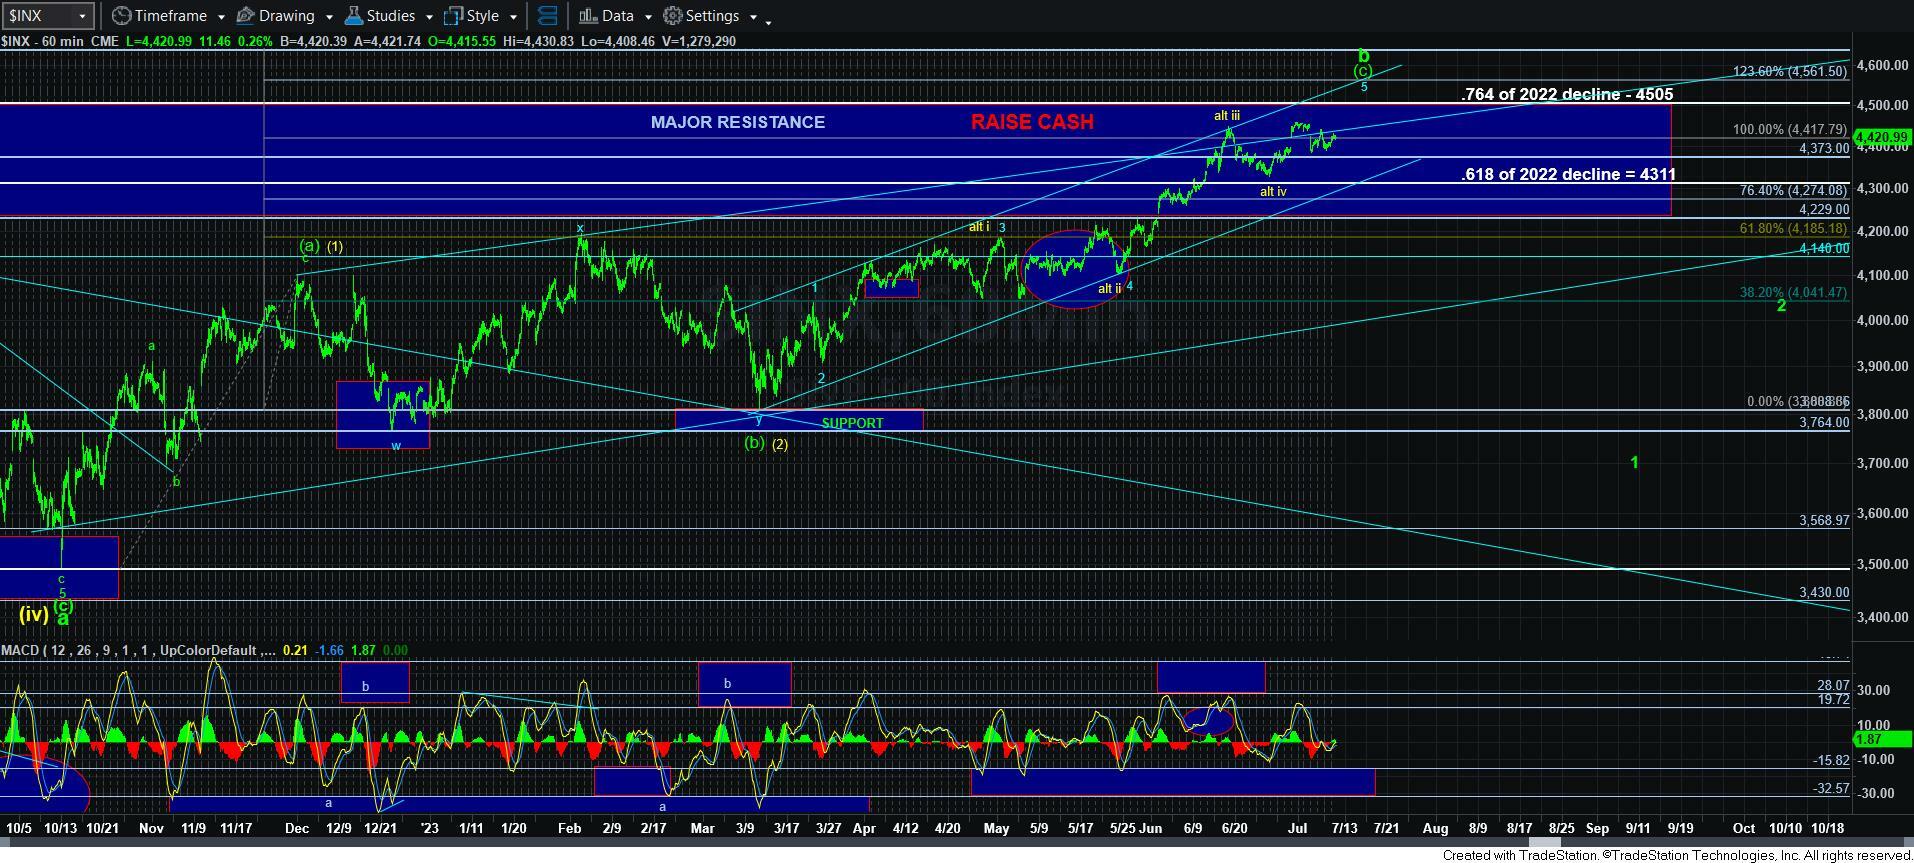
A news event can be a catalyst for a move in the market. However, the substance of that news event will not always be indicative of the direction of the market move. And, the best example of which I can remind you is October 2022, when the CPI came in much hotter than expected, yet it “catalyzed” the start of this 27% rally, which we expected at the time.
So, please do not be terribly concerned with the substance of the CPI report tomorrow. Rather, I would be focusing upon the support, resistance and structure of the market. So, let’s discuss the structure.
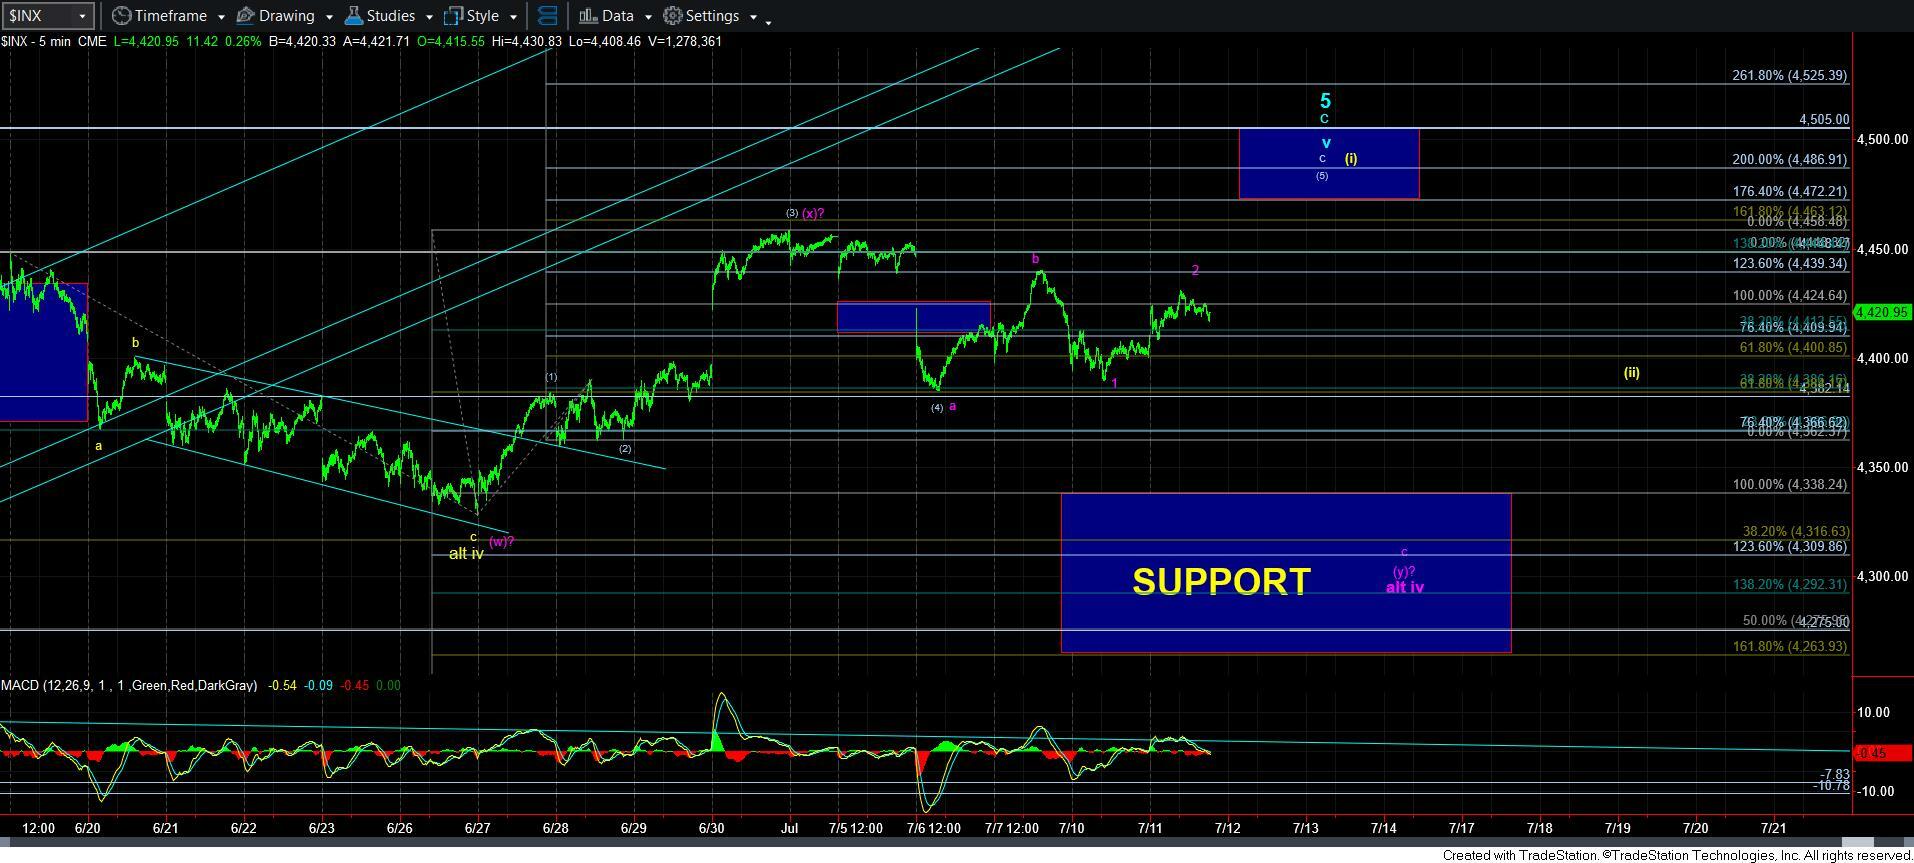
While I clearly have recognized the potential for a more protracted wave iv, I have outlined it in purple on my 5-minute SPX chart in following Mike’s work.
Moreover, this more protracted wave iv has turned much more complex, and can now be counted as more in the way of a w-x-y, which still needs a c-wave down to complete. Furthermore, we have a reasonable 1-2 downside set up for that c-wave, as long as we remain below the purple b-wave high noted on the 5-minute chart.
Therefore, as long as we remain below that b-wave high, we have a set up in place which is pointing us down to the prior target we had for wave iv in the 4317SPX region. However, if the market were to break out over that high, then it would increase probabilities for a resolution to this rally sooner rather than later.
Now, I want to again stress that my perspective is for a higher high to be seen over 4458SPX. You see, the rally into that high was a rather clear 3-wave structure, which makes the probabilities that the market has already topped low in my humble opinion. So, as long as we do not break down below that support box on the 5-minute chart, I am looking for another rally potentially pointing us to the .764 retracement of the 2022 decline, which is in the 4505SP region.
As far as the potential for a direct higher high vs. the more expanded wave iv structure, unfortunately, I do not have a strong preference right now. But, I will say that if we see a 5-wave c-wave decline over the coming days, it will likely be a buying opportunity for a 150+ point potential rally in wave iv towards 4505SPX.
As far as the potential for the yellow count, pointing us next to 4800SPX, I still want to see the wave [i][ii] set up (which is part of wave v of [3]) in order to be confident in the rally to 4800SPX.
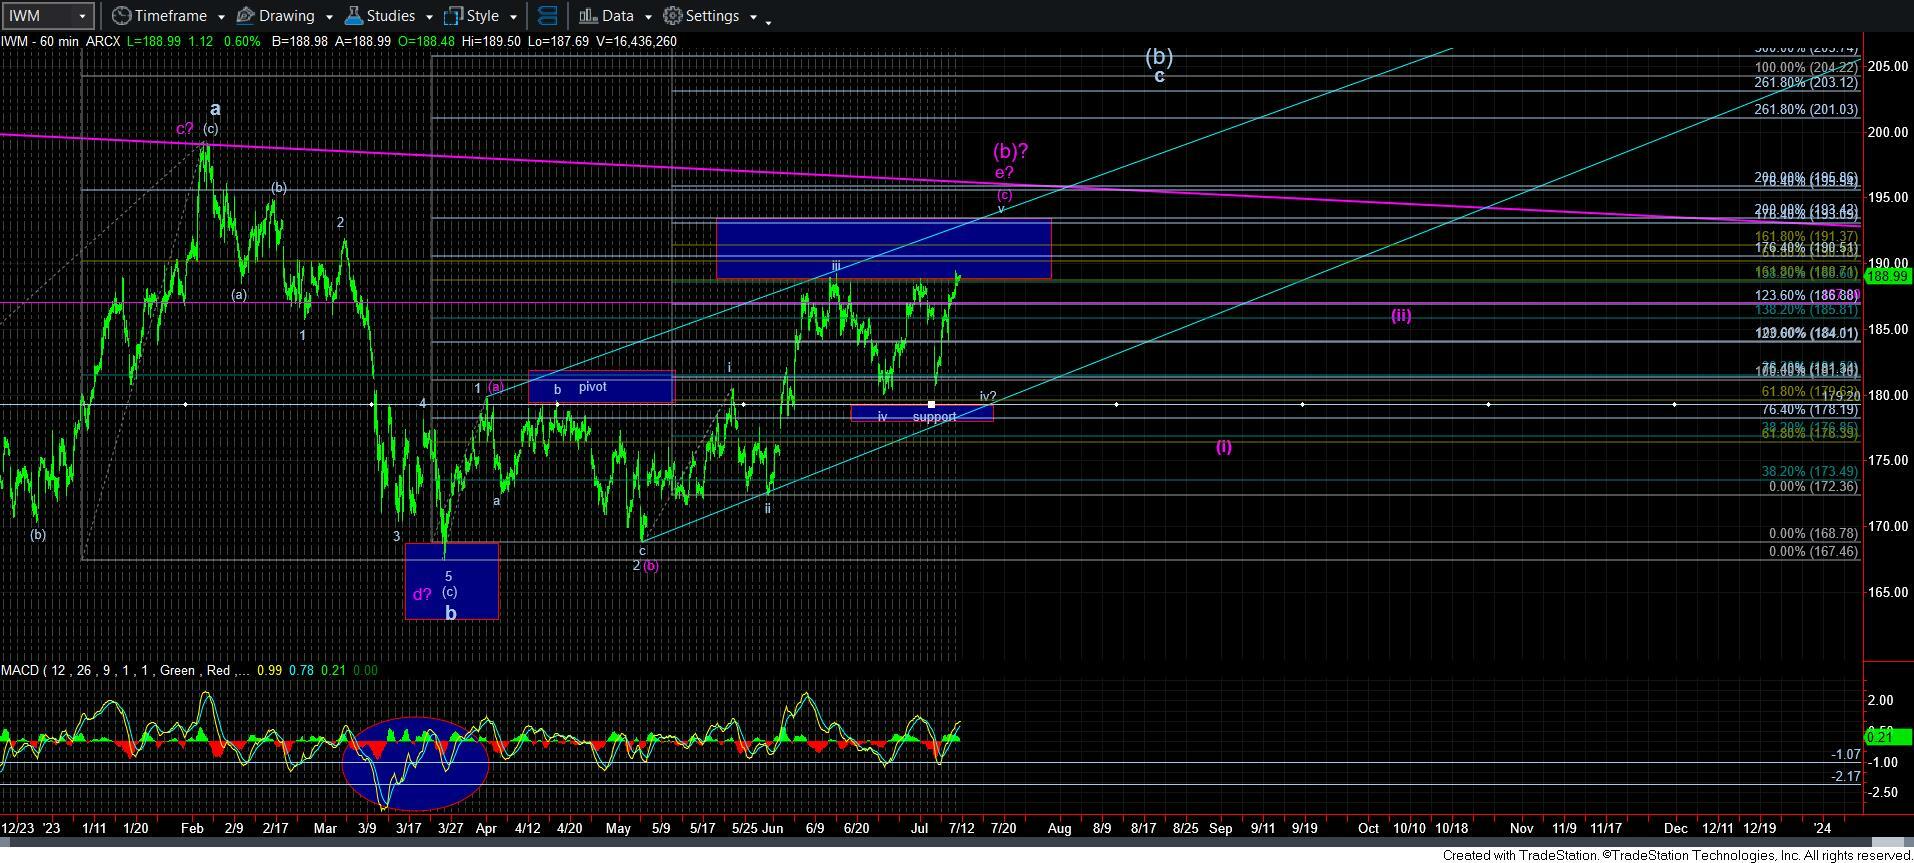
Lastly, I also want to take a moment to mention the IWM. I think the target for this wave v for the IWM is a minimum of 190.50 to 193.50. Of course, we could always see a blow off top that takes us to 196, and the downtrend channel for the e-wave of the triangle. But, the point is that until we get to the 190.50 region, there is still potential that the current rally could be completing a b-wave in a more protracted wave iv in IWM as well. So, it would seem that both charts are well aligned at this time.