Can We See Anymore Twists And Turns?
Well, since we are in a corrective structure, the answer to the question in the title of this update is “CERTAINLY.” Remember, corrective structures are quite variable in nature, whereas impulsive structures are much more predictable. And, since we view the market as being within a corrective structure, we have to assume we can continue to see more twists and turns.
So, allow me to modify the potentials we have left on our charts.
As we know, the market has been consolidating for the last few weeks and likely setting up to drop lower over the coming weeks. The question has been what path this consolidation will continue to take. But, since this is still within a larger degree corrective structure, we must remain on our toes, as it would not be unusual for the market to feign in one direction, only to morph into something else. So, it’s my job to tell you what to watch.
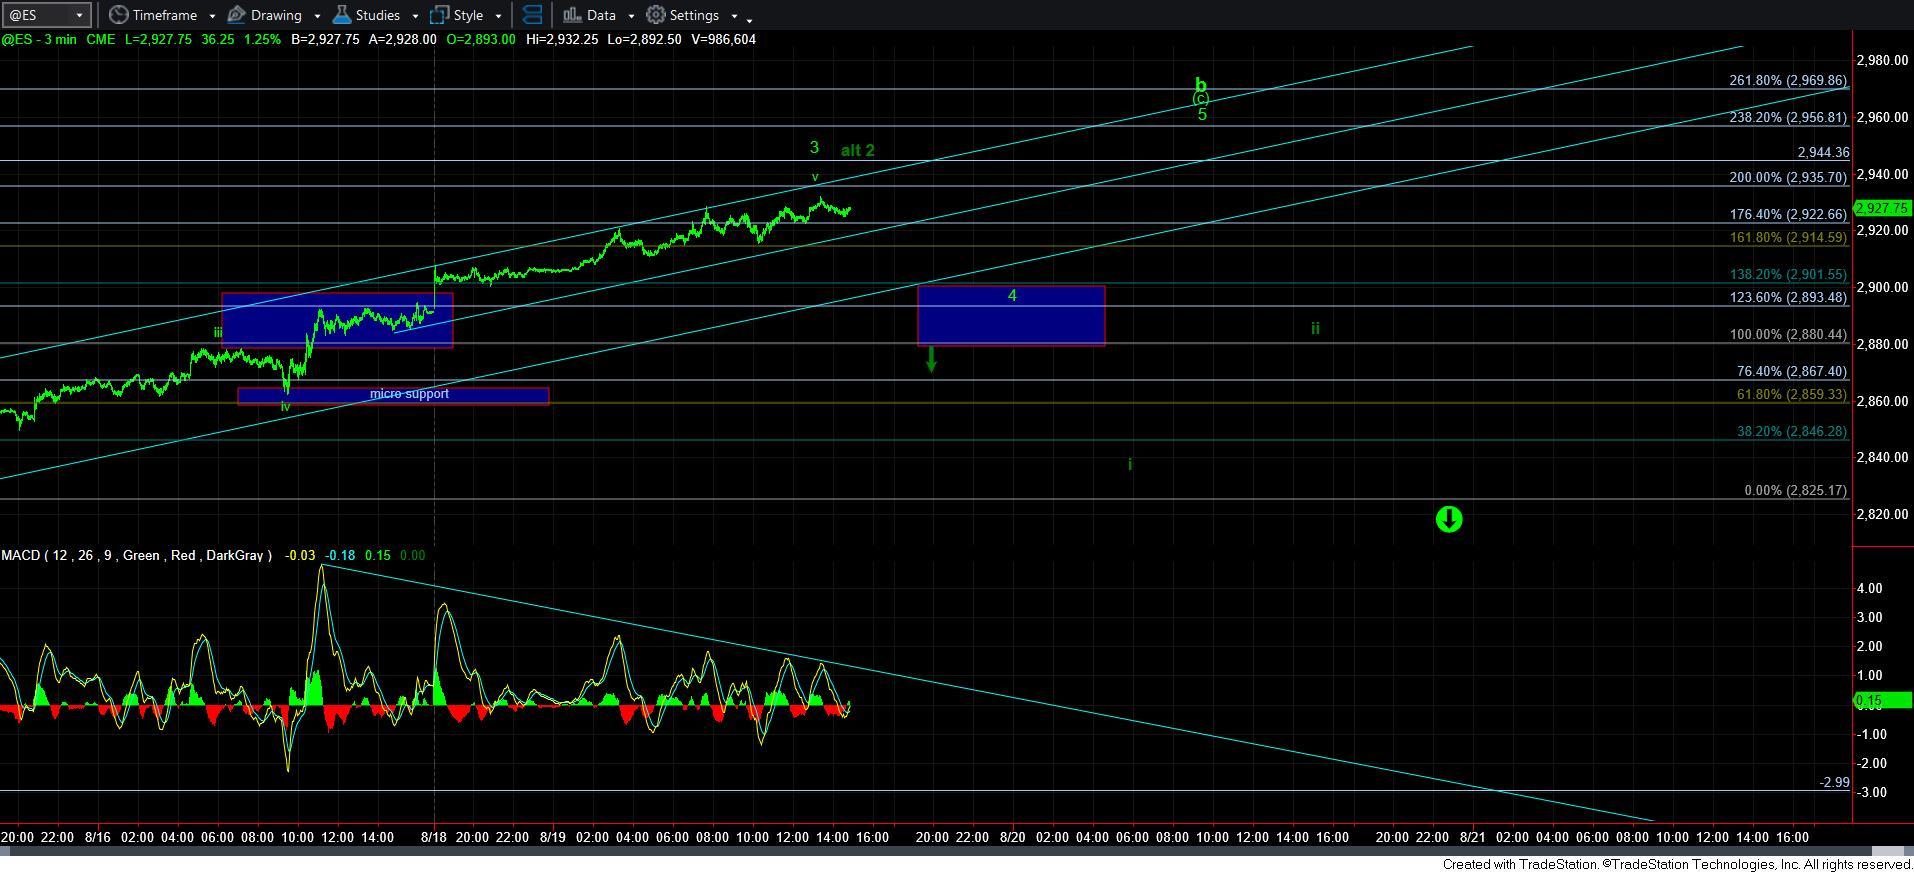
With todays’ gap up through the 2900SPX region, the market has now made it more likely that it wants to target the larger b-wave flat structure. That means that today’s action is completing wave 3 in the [c] wave of the larger b-wave flat. That means the market will be tested on the next pullback (wave 4), which it must pass in order to complete 5 waves up in this potential [c] wave. And, that will complete that larger degree b-wave into the 2950 region, and likely set us up for the next larger decline below 2700SPX.
The support for this pattern is in the 2880-2900 region. So, as long as we hold that support, I can maintain an expectation for a 5th wave higher to complete the [c] wave of this b-wave corrective structure.
However, should the market fail to hold such support, then the next phase will really depend upon how the market breaks 2880SPX support.
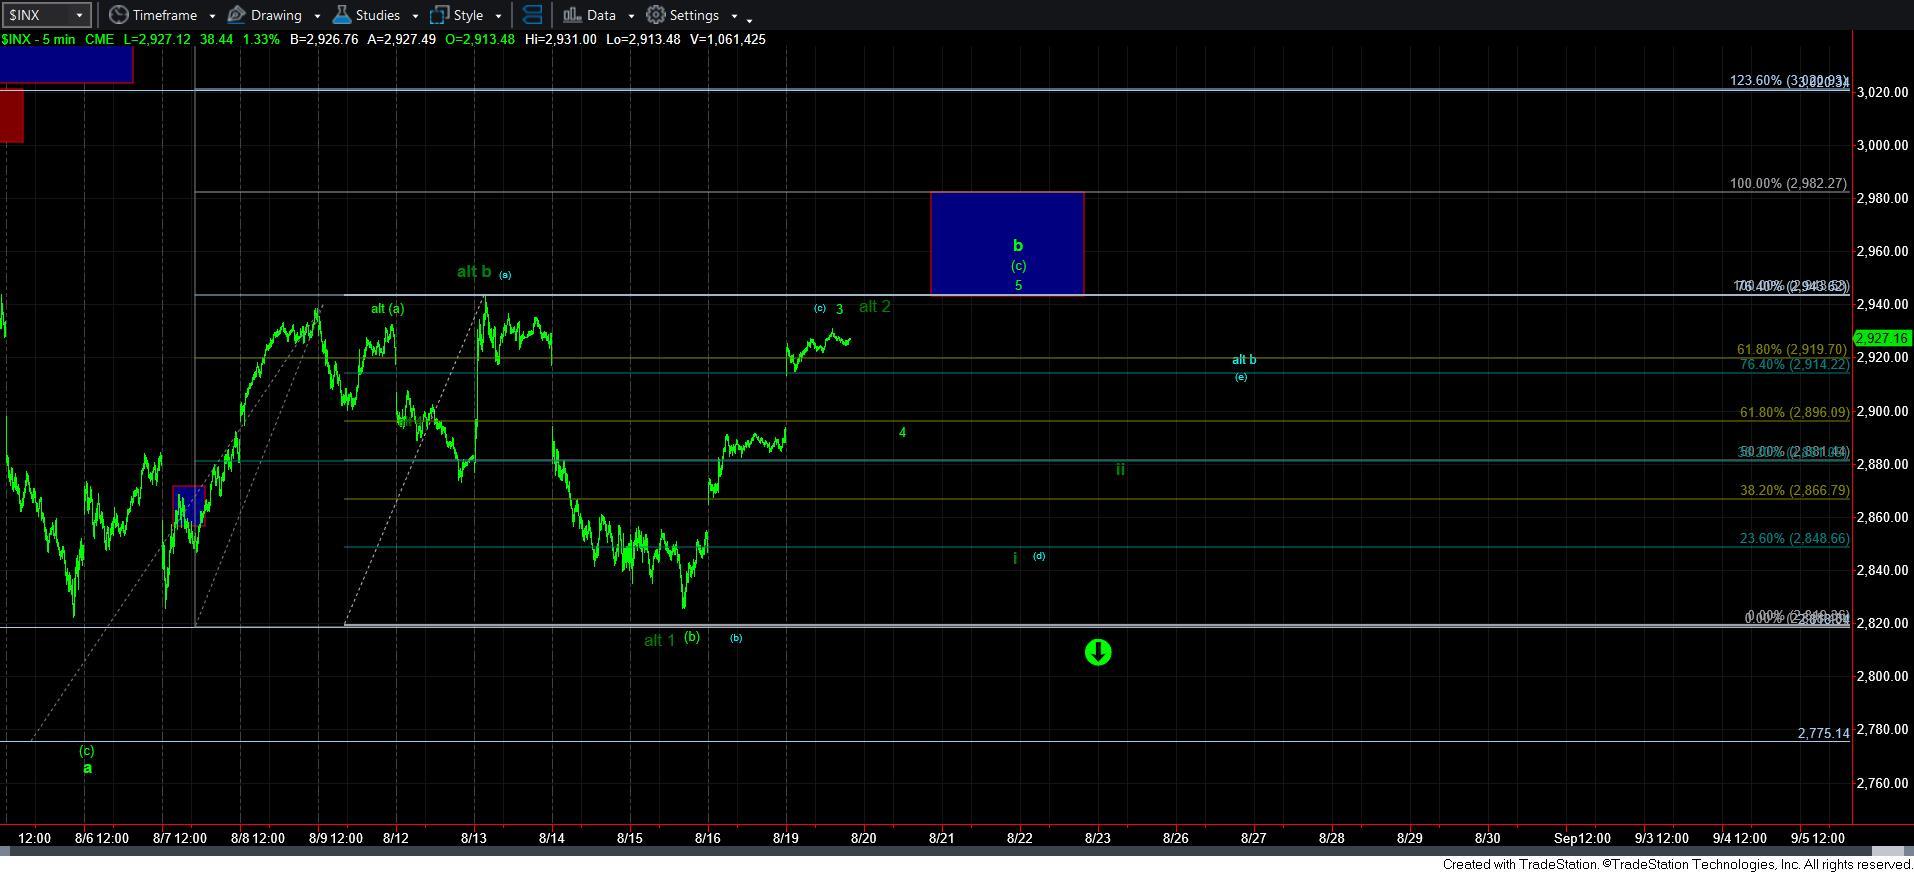
You see, since we still did not break out over last week’s high, we “technically” still have a valid 1-2 downside structure in place. But, it is quite rare that a 2nd wave will retrace this much of wave 1 . . . but, as I noted, it is still possible. Yet, that 1-2 downside structure would actually target the upper end of our expectations for 2685SPX to be struck. However, I would need to see a clear 5-wave decline for wave i (as shown now in dark green on the smaller time frame charts) to be more confident in this potential.
The other alternative if we were to break down below 2880SPX before completing 5 waves up would be a triangle. That is now the count presented in blue on the 5-minute SPX chart. But, this would only take primacy if the market were to break 2880SPX with an overlapping, corrective structure.
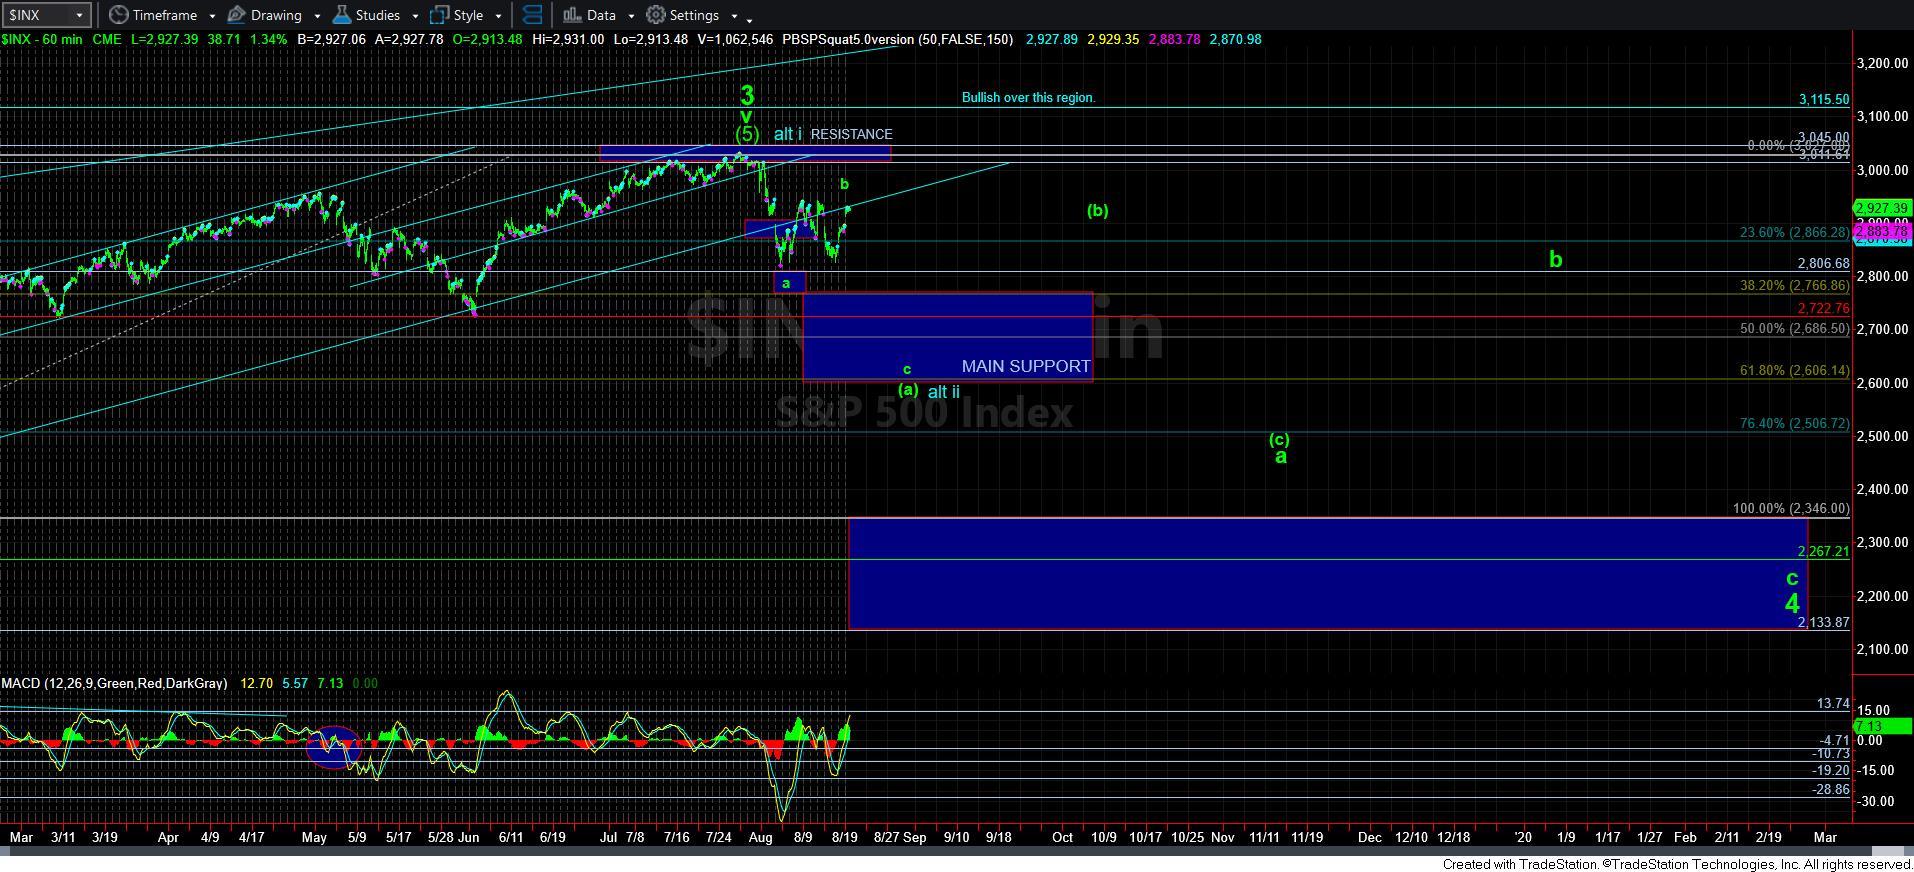
So, let’s review our parameters. The main point you should still take away is that I still think the market is pointing to levels below 2700SPX once we complete this current rally. And, in order to maintain the primary count of the [c] wave of the b-wave towards 2950 region, the market must hold the 2880-2900SPX support on the next pullback.
Should we break below 2880SPX, then we will need to see the structure with which the market breaks below 2880SPX in order to decide whether we have begun the 3rd wave down below 2700SPX, or if we have yet to complete the final legs of the triangle before we begin the decline blow 2700SPX.
While I know that corrective action can be quite frustrating and complicated, please continue to focus on the bigger picture: As long as the market remains below the 2950-2985SPX region, then I am going to expect the market to break below the 2700SPX in the coming weeks, as shown on the 60-minute chart.