Can We Hold Immediate Downside Pressure?
Our financial markets are non-linear systems, which means there is no certainty in the market, despite what many attempt to tell you. Therefore, markets are all about probabilities. And, your trading should be focused upon placing the greatest probabilities on your side of the trade.
Sometimes, the markets will provide clear clues, and other times they will not. During August, the market provided some of the clearest signs I have seen in quite some time despite the whipsaw we experienced. In fact, we were able to foresee most of the potential whipsaw moves we experienced, as the market traced out relatively textbook corrective structures.
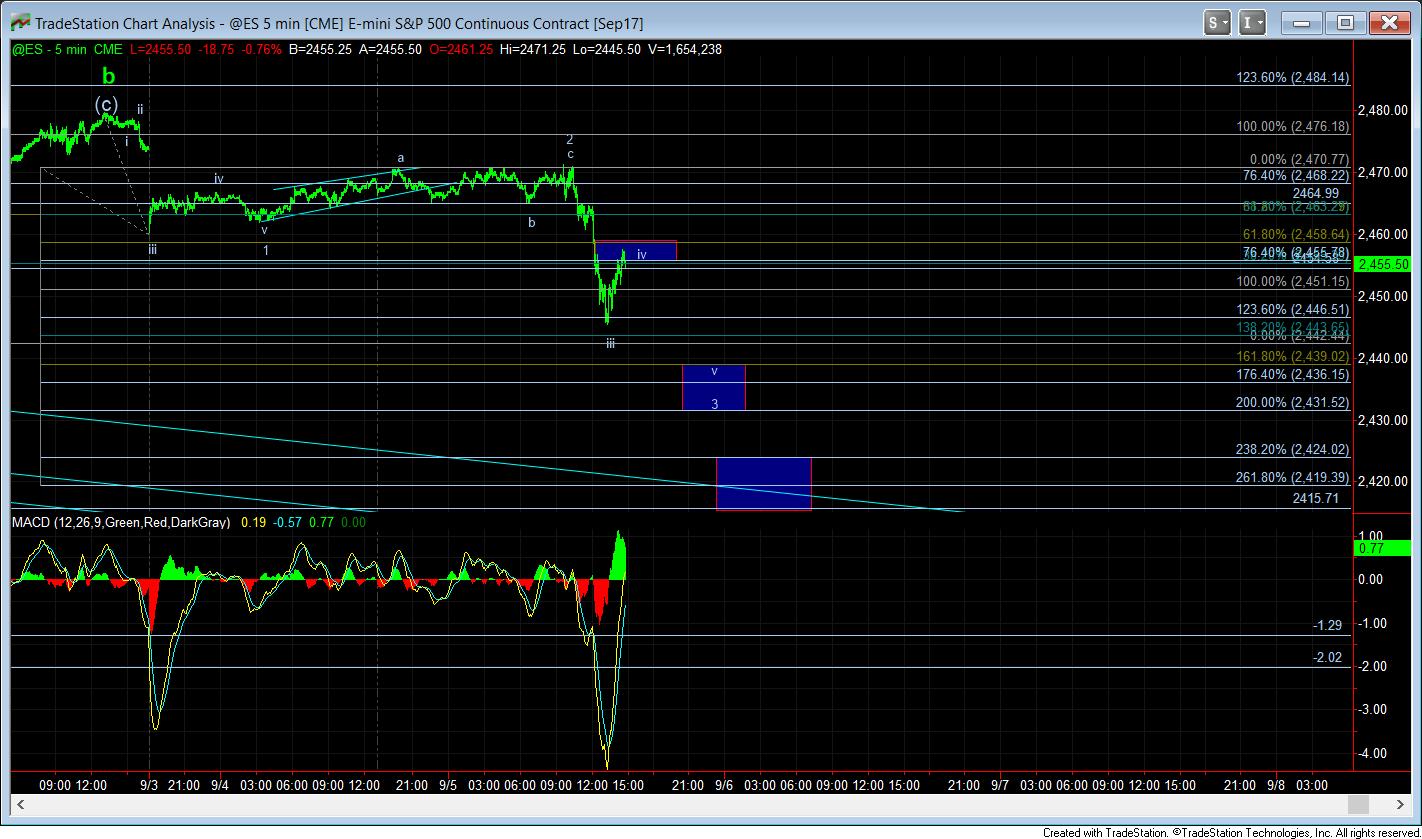
And, that brought us to today. While the market slightly exceeded our (b) wave rally target by about 5 points, it provided a downside set up from that region. While I was not entirely confident in that set up this morning since it relied upon a truncated bottom to wave 1 down, as shown on the 5 minute ES chart, it did break support and followed through.
But, in order for this to be a c-wave down, we usually expect an impulsive drop in 5 waves. Due to where the market has been pointing on the drop, it placed certain questions in my mind as to whether a c-wave down was in play. First, the standard target for a 5 wave structure was pointing towards the 2431ES region, which is well short of the ideal 2400 minimum target I would want to be seen. Moreover, it started extending a bit more than a larger wave 1 down in the c-wave would normally suggest as well. But, that still remains a potential.
As far as we reside as I write this, if this is indeed going to follow through as an impulsive structure to the downside, the market should not break back through the .618 extension down, which is in the 2459ES region. A break through that region would suggest something else is playing out. But, as long as that resistance is held, pressure will still remain down.
Now, if the market does remain below resistance, and follows through to the downside, then I am looking for the 2430’s on the next drop. And, ideally, I would even want to see much deeper extensions down to the lower blue box in the 2420’s.
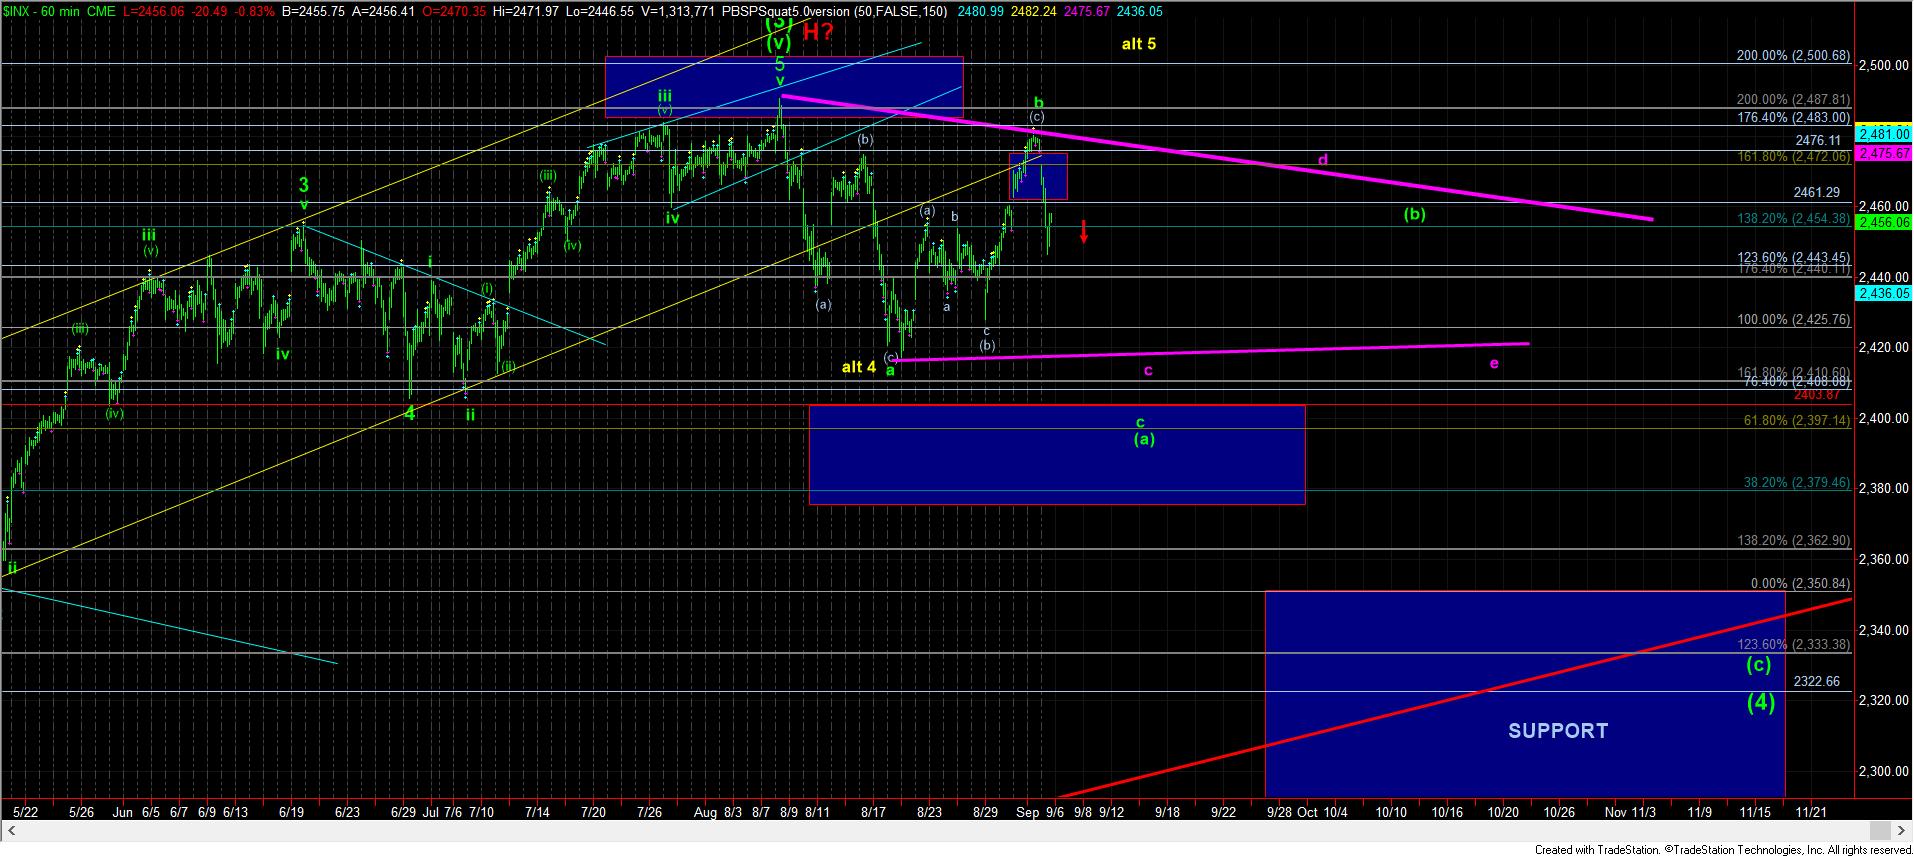
However, if the market is unable to maintain below resistance of 2459ES, then we may have to consider the triangle I have added to the 60-minute chart, or several other potentials, for which I think may be too much to go through at this point in time.
Ultimately, the two main points you need to take away for today is that as long as 2459ES region maintains as resistance, we are pointing much lower into tomorrow. Should we break out over 2460ES strongly, then last week’s high is the key to maintaining pressure down in the triangle, or even in an ending diagonal for this c-wave down. It means the pattern will become MUCH more complex if we do not hold immediate resistance.
As I have warned so many times over the last month, the market is likely in a 4th wave, and it comes with some significant whipsaw and a lack of clarity at times we need to deal with. The points of clarity right now revolve around the micro resistance noted above. The manner in which we complete this downside pattern will depend on 2459/60ES in the immediate sense.
And, again, I will issue the warning that this is still a bull market which needs to be respected. That means your primary focus should be on where you can buy longs, and not necessarily where you can short within a 4th wave. Shorts will often see much whipsaw, but longs can be relatively confident that we will resolve this pullback with a rally to the 2600SPX region, at least in my humble opinion.