Can We Get That Downturn?
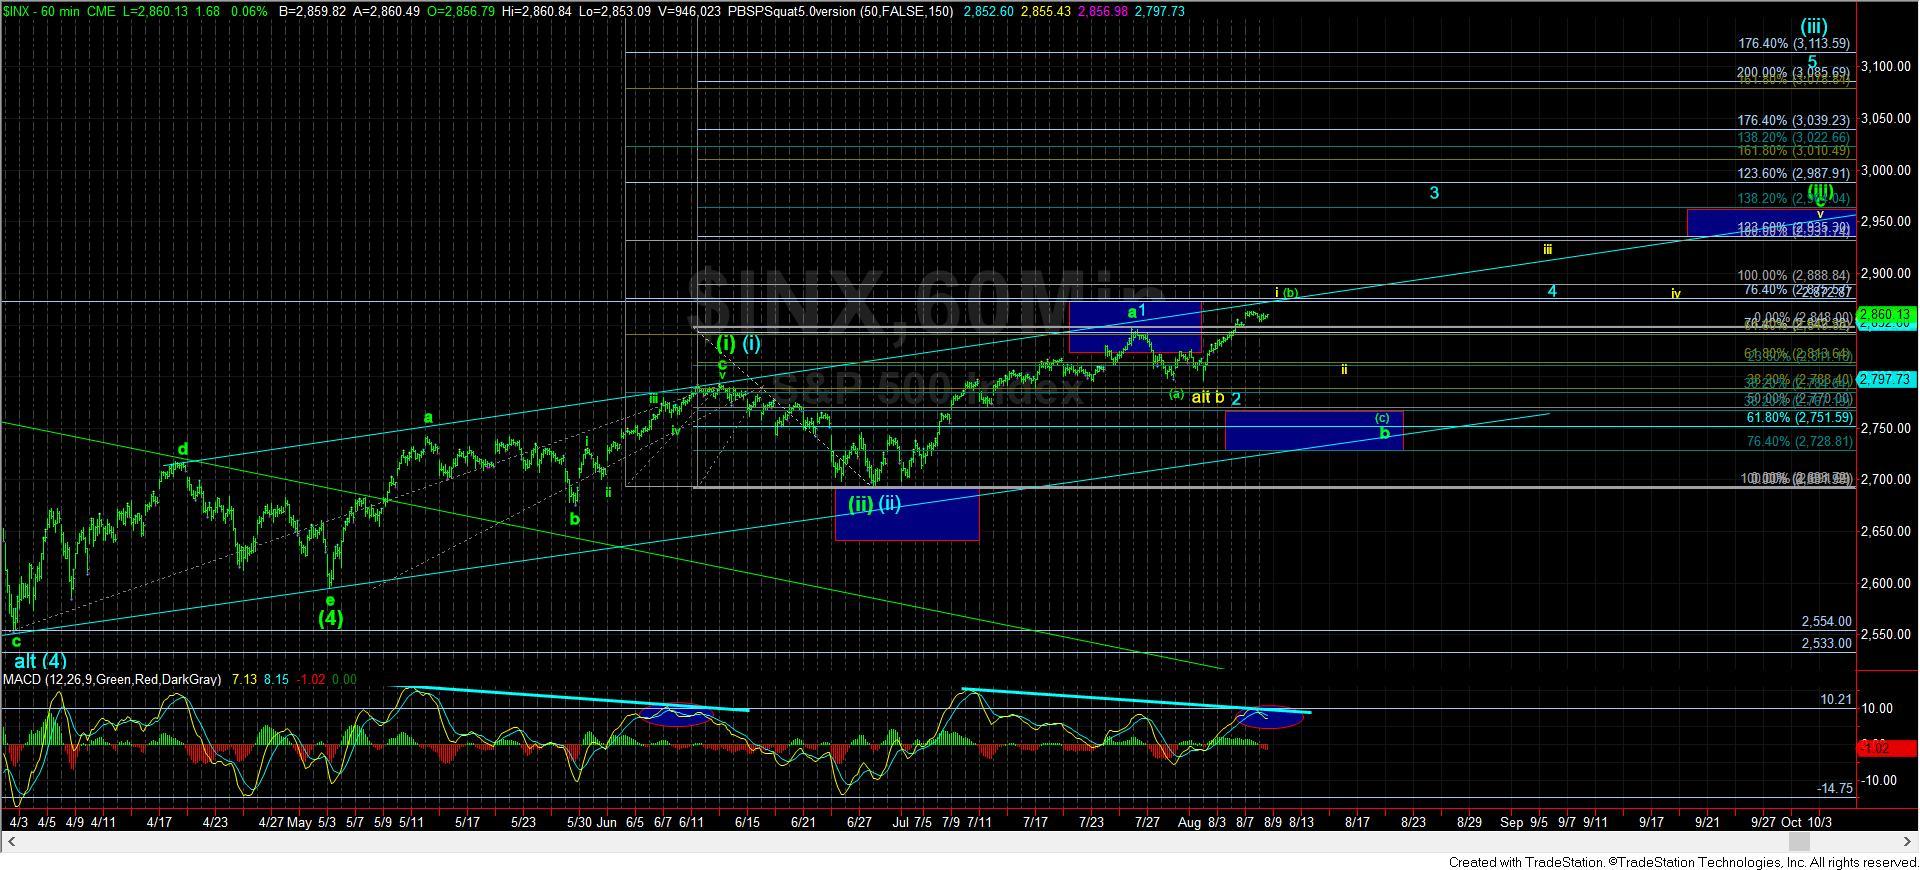
With the market consolidating near the highs today, we still have no clear indication that we have begun a (c) wave down. But, with the market pushing as high as it has, I presented to our members this morning an alternative path which is more bullish. While it is clearly not my preferred path at this time, I have added it to the chart at the pressing of a number of members. This is what I wrote this morning:
I have had a number of people ask me to show them how the more bullish break out pattern would look in the SPX, so I have added part of it in blue (but it is not representative of the timing of the move). Again, I want to note that this does not align well right now with the bigger targets and structure we have in the SPX, so clearly this is not my favored path at this time. I just wanted to make that clear again. But, if it proves itself with a break out through 2890 in the coming week or two, then I will have to adopt it.
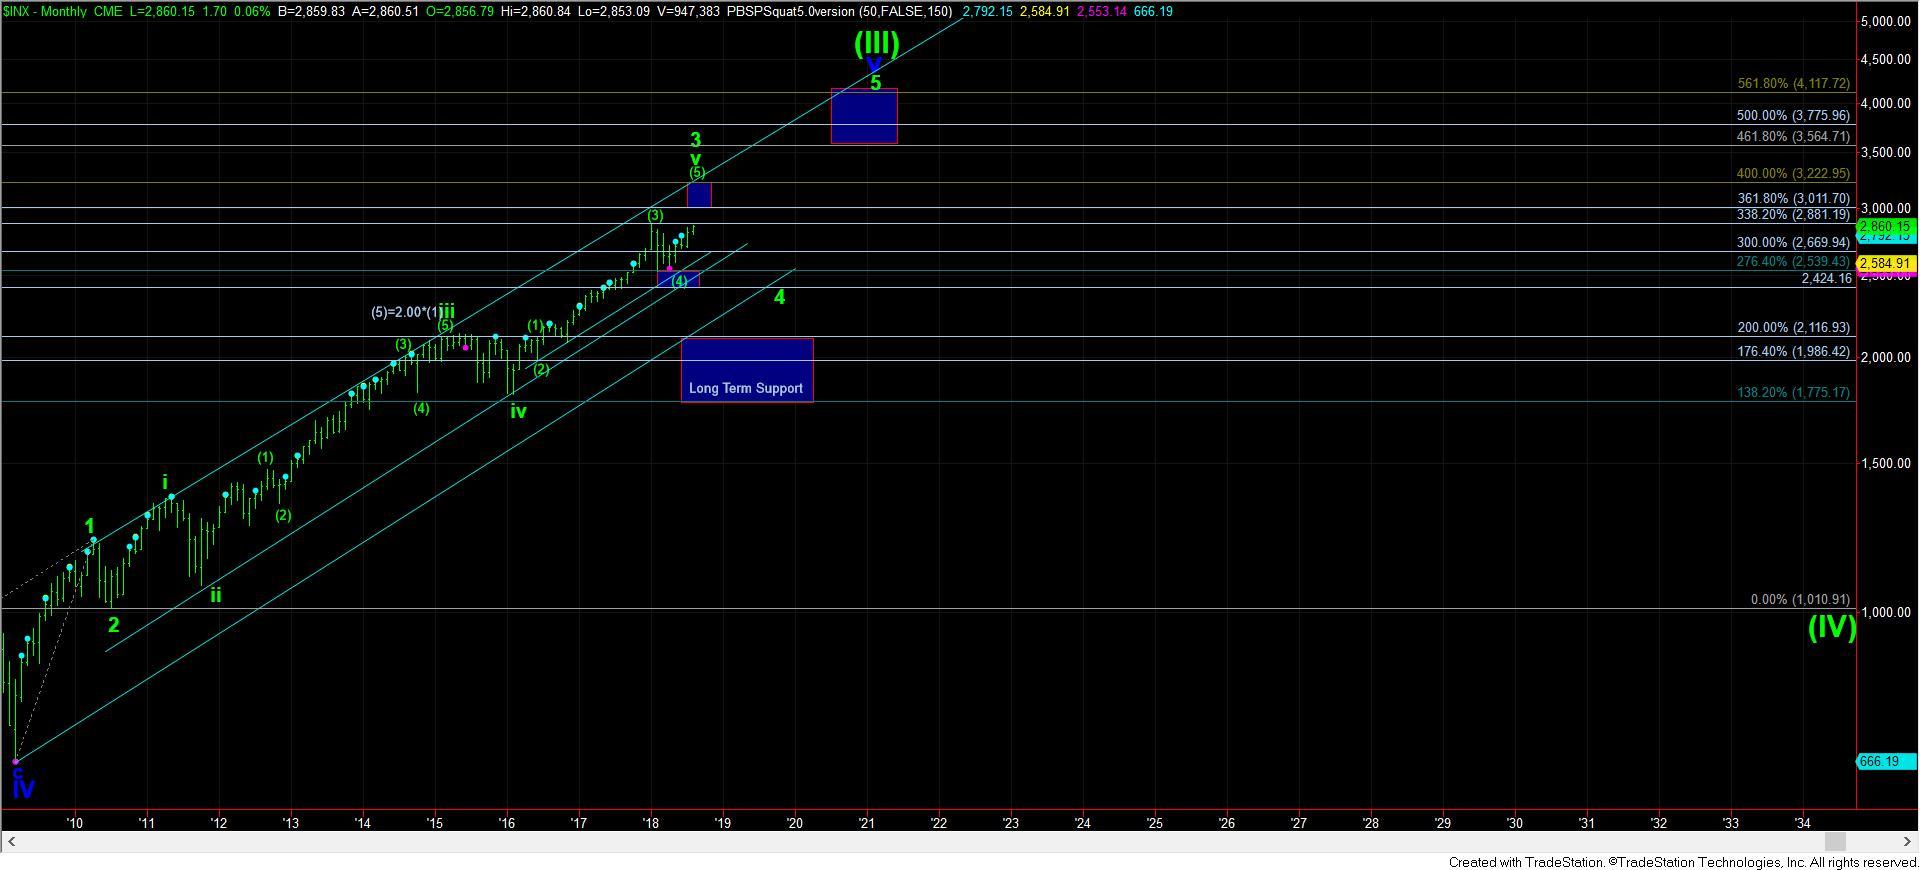
As you can see, the blue count has the wave (4) completed at the early April lows. That would then count the rally off that low as a leading diagonal for wave (i), with the pullback into the end of June as wave (ii). But, the main issue I have with this structure is that waves 1 and 3 in this (i) would be 3 wave structures, whereas the 5th seems to clearly be a 5 wave structure. So, this is another reason I have a hard time buying into this perspective.
Also, the 1.764-2.00 extension of this structure is only 3110-3170, which clearly falls short of the ideal targets we have in the bigger structure. While this can certainly extend to targets beyond standards, I usually like to see some confluence with the 2.00 of a smaller degree structure and a target with the larger degree structure. I do not have that here, which also makes this quite questionable to me at this time.
While this is the bullish impulsive count I have been tracking, the main reason I have not presented it is because I have not viewed it as the highest probability since it has so many issues, some of which I just outlined above. For now, I have to maintain my expectations for a (c) wave down, with the alternative being the yellow count. Yet, as I noted, it is hard to count that bottom last week as a completed correction.
I think the next week or two should finally provide us with the answers we seek about the path to 3000+. And, if it is the more bullish count in blue, then I will likely be buying the wave 4 pullback in blue after the break out occurs, as it often re-tests the break out point from above, which coincides with our Fibonacci Pinball expectations of a retrace back to the .618 (2840)-.764 (2875) extensions.
(By the way, the market often gets that turn we are looking for when I highlight the alternative count at the urging of our members).
As far as what I am seeing right now on the 60-minute chart, the MACD has now turned down into negative territory and setting up a clear negative divergence with a higher price high. While price can certainly press higher one more time to test the resistance between 2870-75SPX, it is not necessary, but it will also create even further extreme divergences at this high region.
And, as I said last night, the next decline will likely provide us guidance for the rest of this year, as well as going into 2019. So while it may take another week or two, this period should clear up which count is the operative one to take us to the wave (5) top before we begin the 20-30% correction we expect to begin in 2019.


