Can We Get A Retrace?
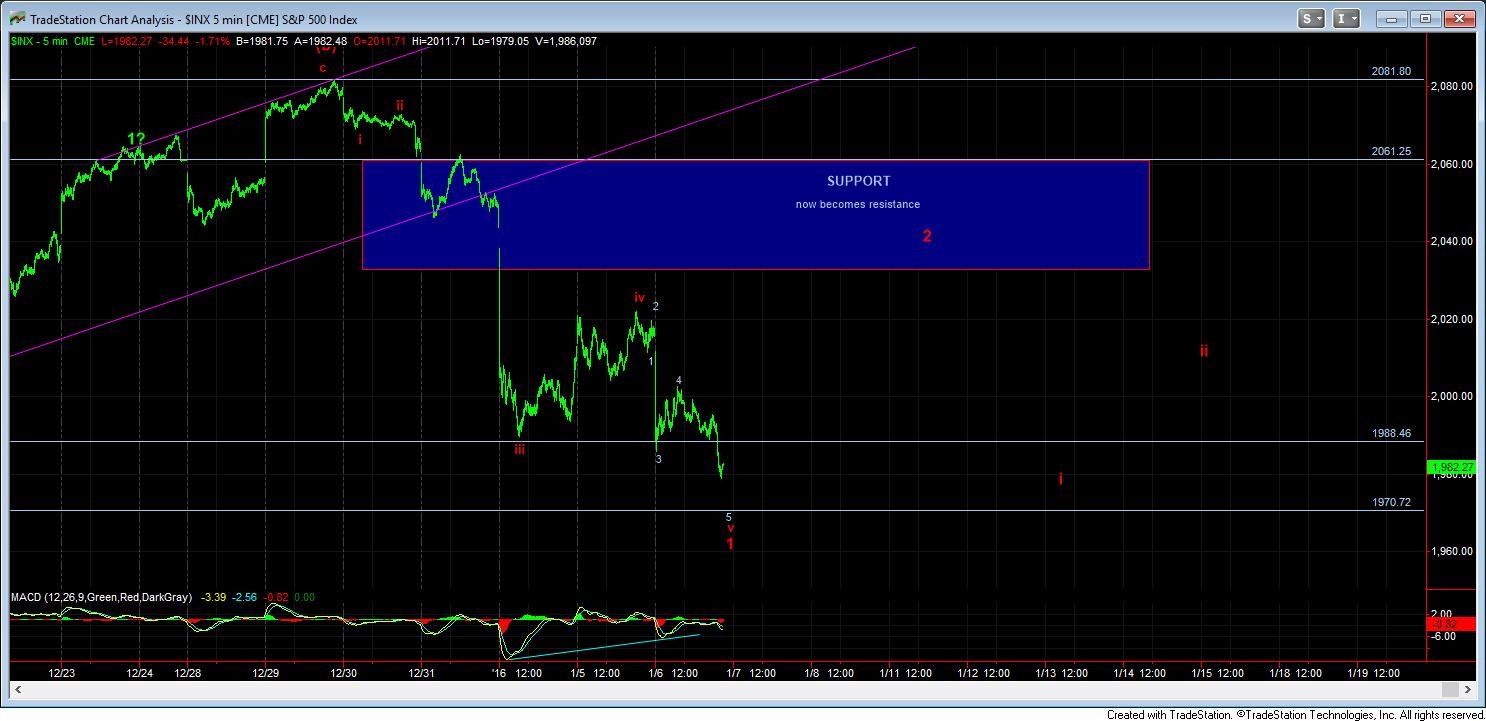
The structure of the decline now looks like an almost full 5 waves down from last week's high. This will be the count I maintain as long as the market remains over the 1965/70SPX support. That means that, if this is correct, we “should” see a wave 2 retrace take hold into the end of the week, or even into early next week before we continue lower.
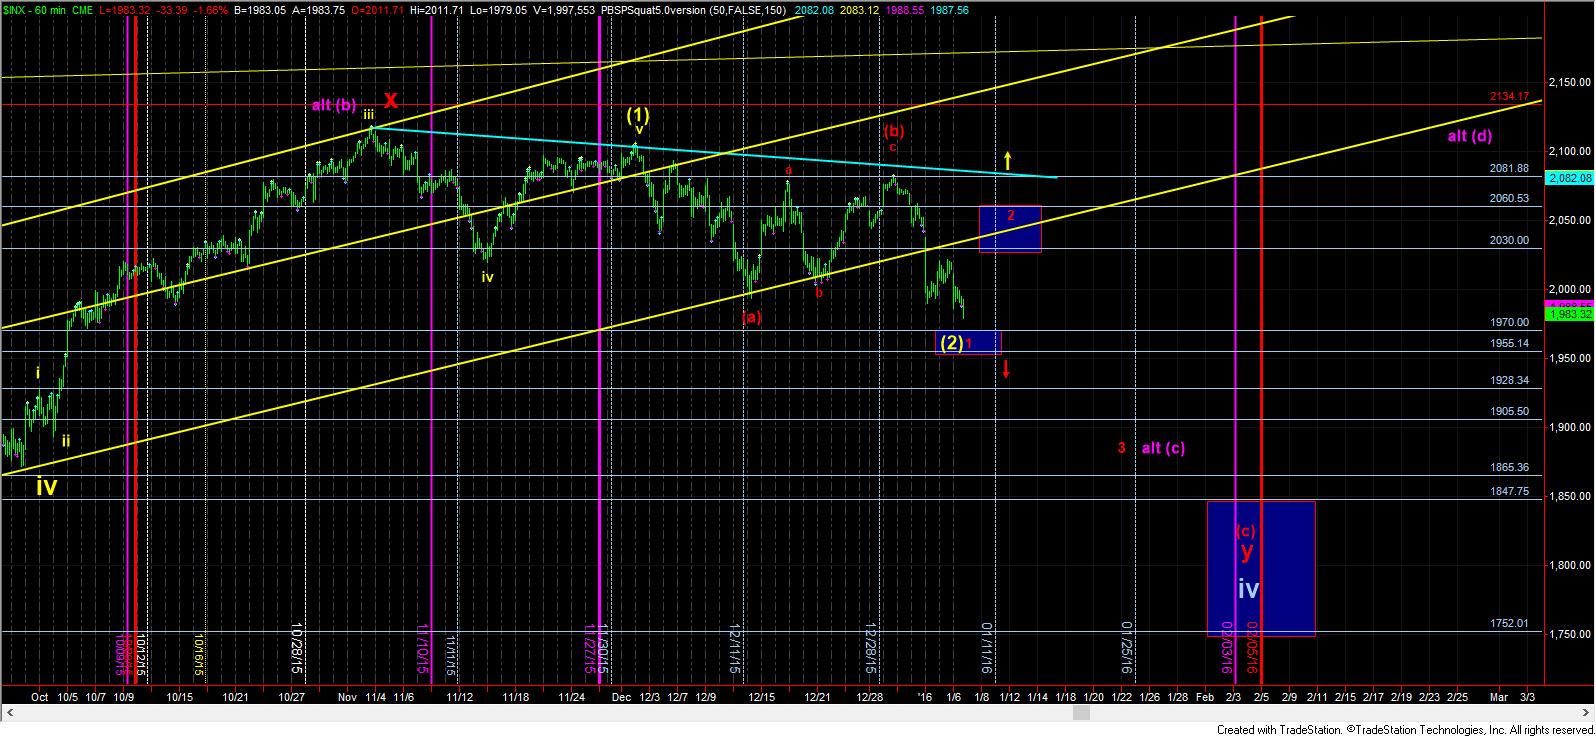
Again, due to the bulls failure in their strong set up last week, the bears now have the ball as long as we remain below 2082SPX, and, more specifically, the 2030-2060SPX resistance region. And, that is the region I would expect to be tested in a wave 2.
Alternatively, should we see a break down sooner rather than later below 1965SPX, it opens the door to the 1905SPX region next, and potentially even lower, depending upon how extended the wave 3 down takes hold. But, for now, I am going to maintain an expectation of the set up noted on the 5 minute chart into next week before bigger downside takes hold.
For now, 1989SPX is the initial resistance which must be broken to the upside, with follow through over 2002 to get the ball rolling on the bigger red wave 2.