Can We Find A Bottom So Quickly?
With the break down below 2123SPX at the open, the market hung around near there for about 5-10 minutes before it began today’s decline. This gave everyone who wanted to join the downside “celebration” the opportunity to jump on board. And, amazingly, in one day, the market has taken us down to the lower support region.
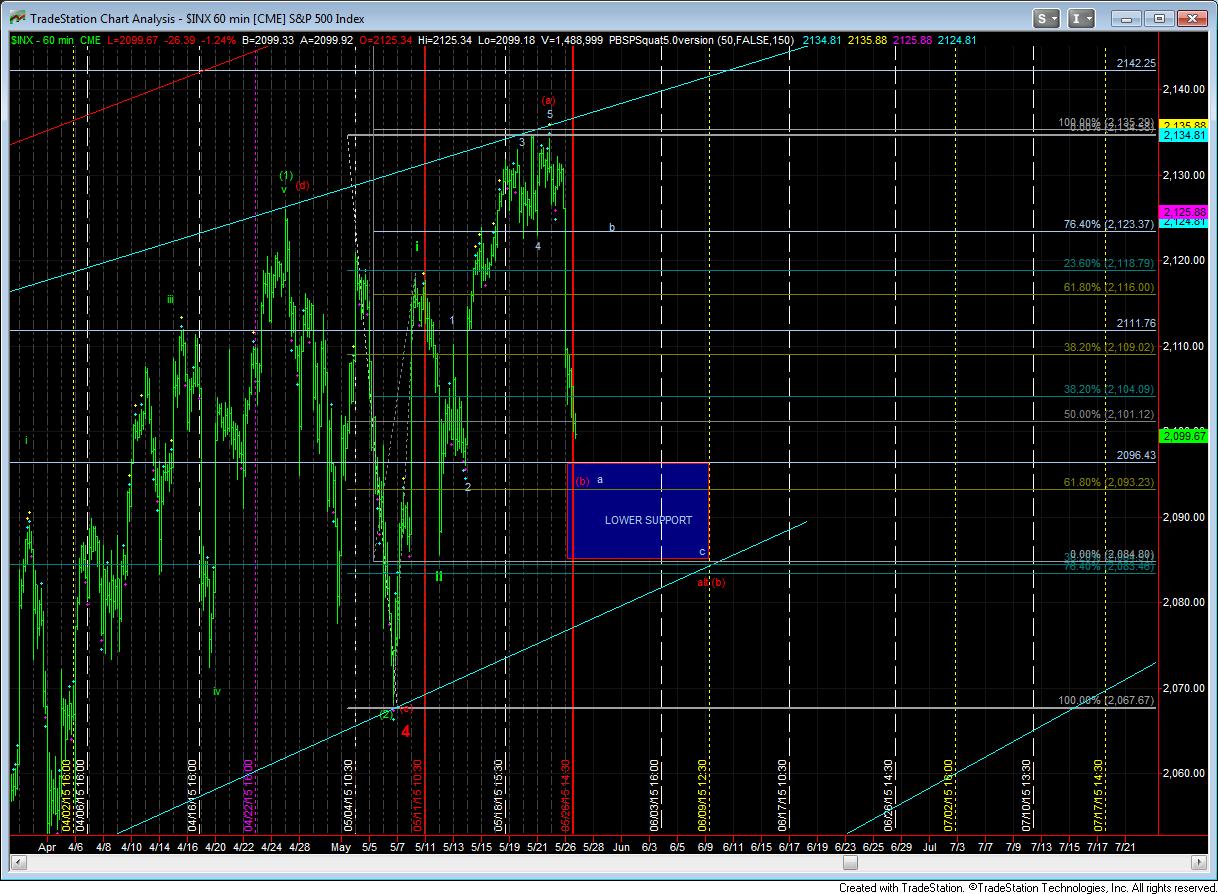
For now, this is enough of a decline to consider all of the (b) wave as completed. We have dropped beyond the .500 retracement of the (a) wave, and we seem to be in an ending diagonal down on the 3rd wave down off the highs, right towards the top of our lower support region.
As you can also see on the chart, we are right at a Bradley turn date, but it is truly unclear as to whether Bradley represents a high on Friday, or a low today. So, for now, I am going to discount this issue.
As far as the pattern, the next move up must be a 5 wave structure if the bottom is truly in. Remember, we would expect that the next move up in the market is a (c) wave, and those are 5 wave structures. Any rally which is less that a clear 5 wave structure off this region will have me in the alternative count with this being only an a-wave off the highs, with the entire (b) wave potential taking us into next week.
But, as I noted over the weekend, if this is going to be a diagonal, the risks have clearly increased and one wants to think long and hard how much upside risk they are willing to take. The ideal patterns still suggest higher highs, but diagonals are scary patterns to attempt to eek out the last percentages from. And, lastly, as a reminder, a break down below 2075SPX would get me to strongly consider that the bull market 3rd wave move off the 2009 lows is done, and we are heading down to the 1800 region for wave 4.