Can Bears Push It Over The 6550SPX Line?
Today, price has spiked below the pivot. But, the action we are seeing after that spike is more of a "comeback" so far than it is a follow through.
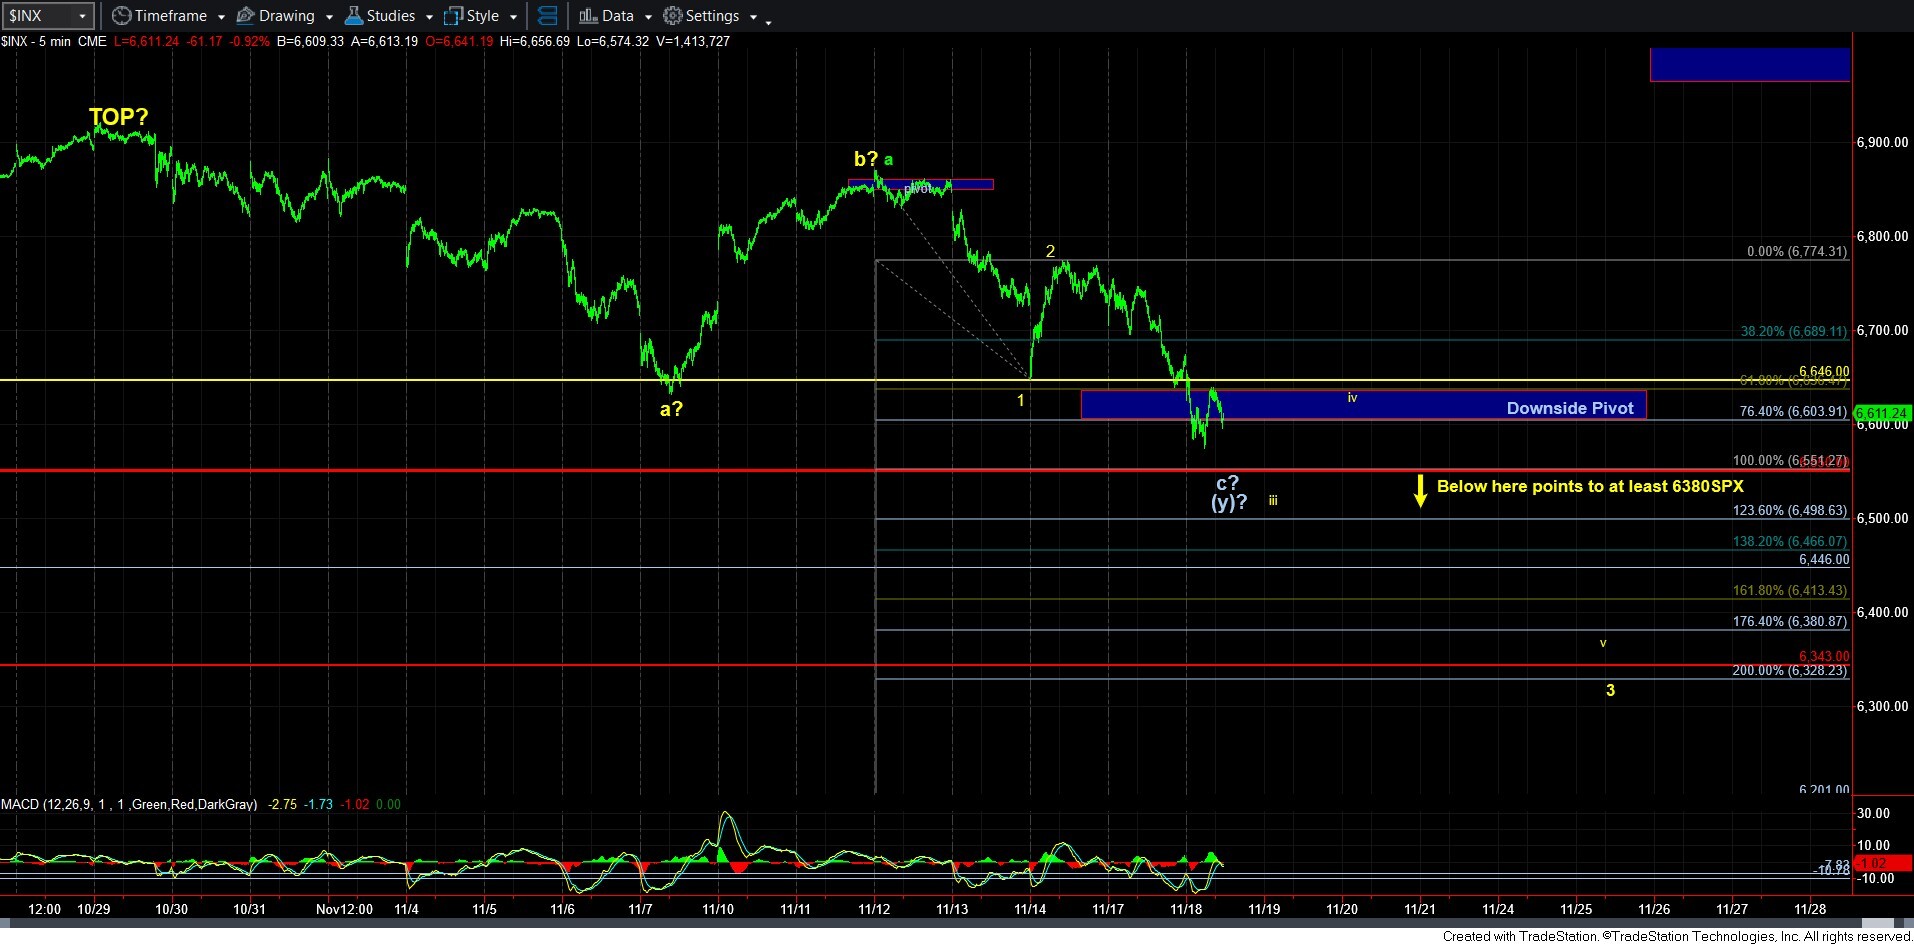
The market had a potential 1-2, i-ii downside set up that has developed, which should mean that a heart of a 3rd wave down should be in progress. That means that once the market breaks down below the pivot between the .618-764 extensions of waves 1-2, and drops to the 1.00 extension or lower, then the likelihood resides with the 3rd wave down. However, it must then remain below the pivot on the wave iv of 3 bounce in order to keep pressure down in wave v of 3.
Today, the market spiked the pivot on the 5-minute SPX chart, but we did not get down to the 1.00 extension. In fact, the 1.00 extension actually resides at the all important 6550SPX support level. But, we did not follow through down to the 1.00 extension. Instead, we spiked the .764 extension and have since come back up as of my writing this update.
If the market is indeed in a 3rd wave down, I would expect that we will continue down to the 1.00 extension and potentially even break it. If we do not, then there is a complex and less common pattern which can still point us to one more higher high, as amazing as that may sound at this point.
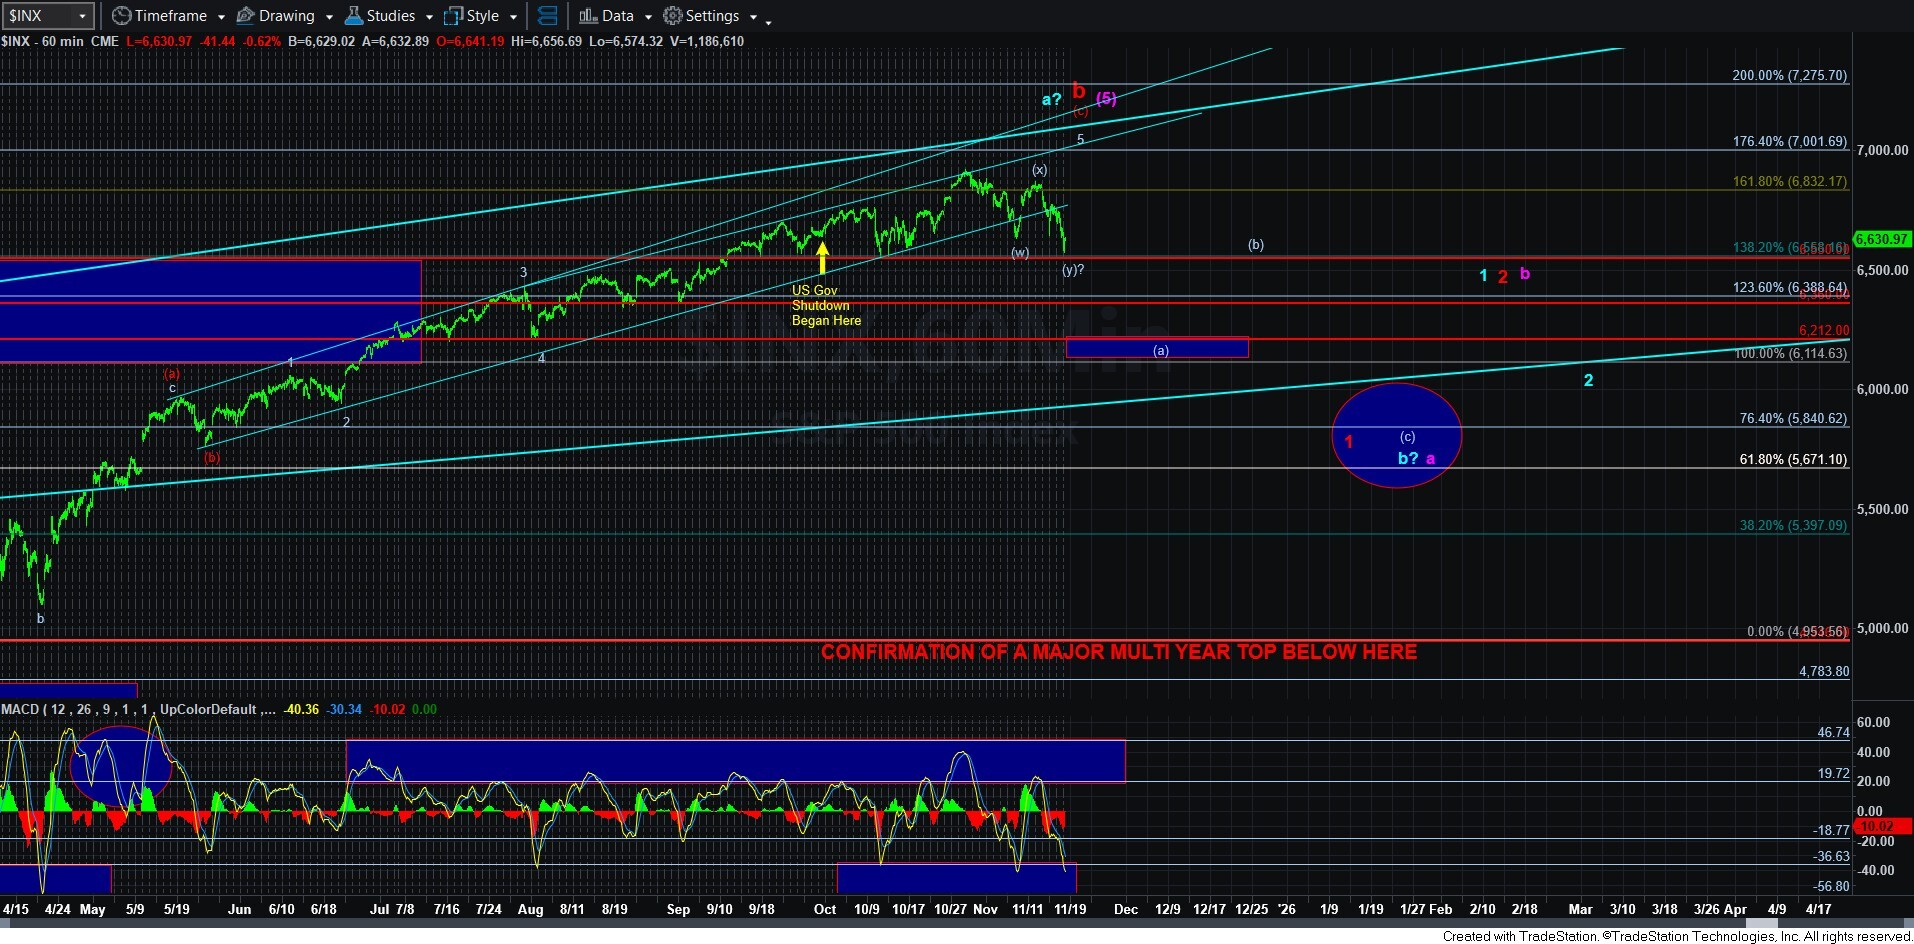
Remember, without a sustained break of the 6550SPX support region, we have no clear indication that a top is in place yet. Moreover, the 60-minute MACD is back at its support region again. So, we have to be aware of a potential whipsaw in this region. That can happen with a (w)(x)(y) pattern.
In that pattern, then (y) wave breaks down into a 3-wave a-b-c structure. I have shown this pattern on the 60-minute SPX chart, and the 5-minute SPX chart. And, if we do not see a break down below the 6550SPX region VERY soon, then this becomes much more likely and can again point us back up to the 7000SPX region.
We know that the market has been quite stingy with pullbacks since the April low. So, until we actually break support in a convincing manner, we cannot assume that the bears are taking control of the market yet. But, if we do see a break down below the 6550SPX region very soon, then the pivot noted on the 5-minute SPX chart will become our resistance and the market "should" unravel quite quickly to the downside if this is truly the heart of a 3rd wave. But, again, due to the stinginess of the market on the downside, and due to the MACD now hitting support, we must be aware that the bulls have not yet lost control of the upside potential, even though this is a relatively less common corrective structure attempting to hold support.