C-Wave It Is
With today’s downside follow through, not only have we broken the triangle potential, but we have solidified the c-wave down count. It has been our primary count this entire time, but we finally can now focus on it without any distractions.
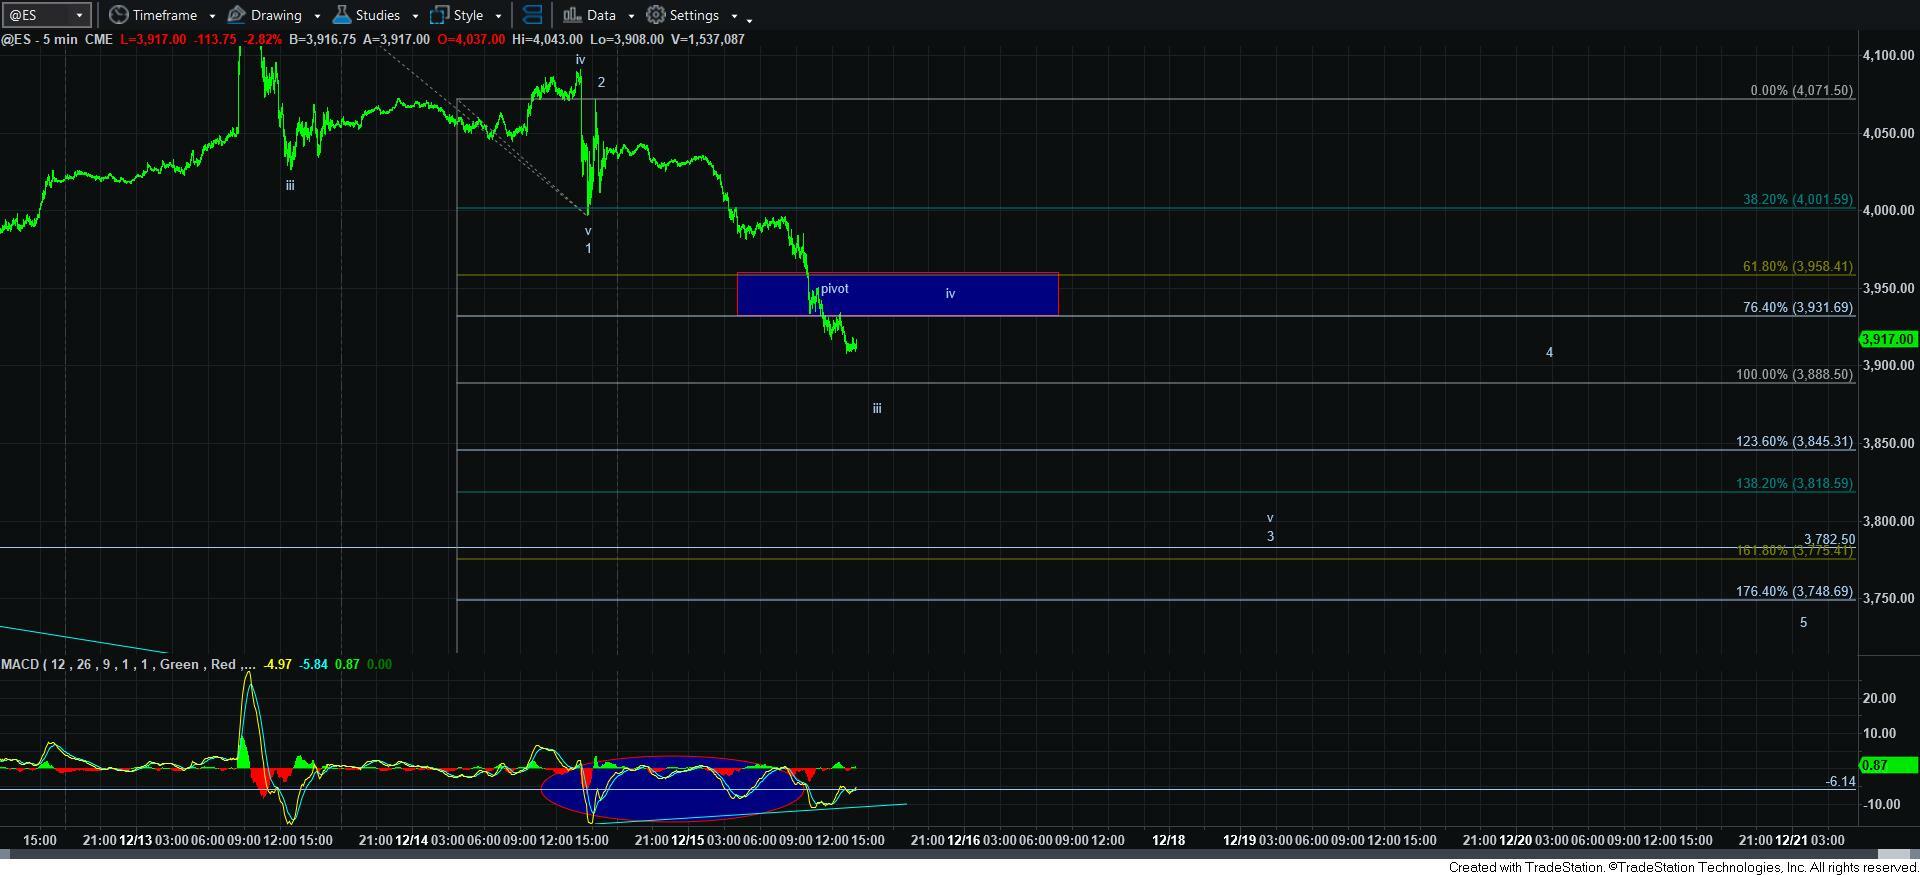
As I mentioned in the initial move down off the b-wave high, it is hard to count an initial 5-wave decline off the initial high. Therefore, as I have also mentioned before, it leaves us with two paths for this c-wave down.
The first path is outlined on the 5-minute ES chart, and tracks a standard Fibonacci Pinball structure. It would point us to the bottom of the target box on the SPX charts (and maybe even a little lower). But, I will note that there are a number of issues with this count, as the initial 5-wave decline is not exactly clean, and the wave 2 is quite relatively small. Yet, to keep this really simple, as long as respect the pivot on the 5-minute ES chart, then I will continue to follow this path lower.
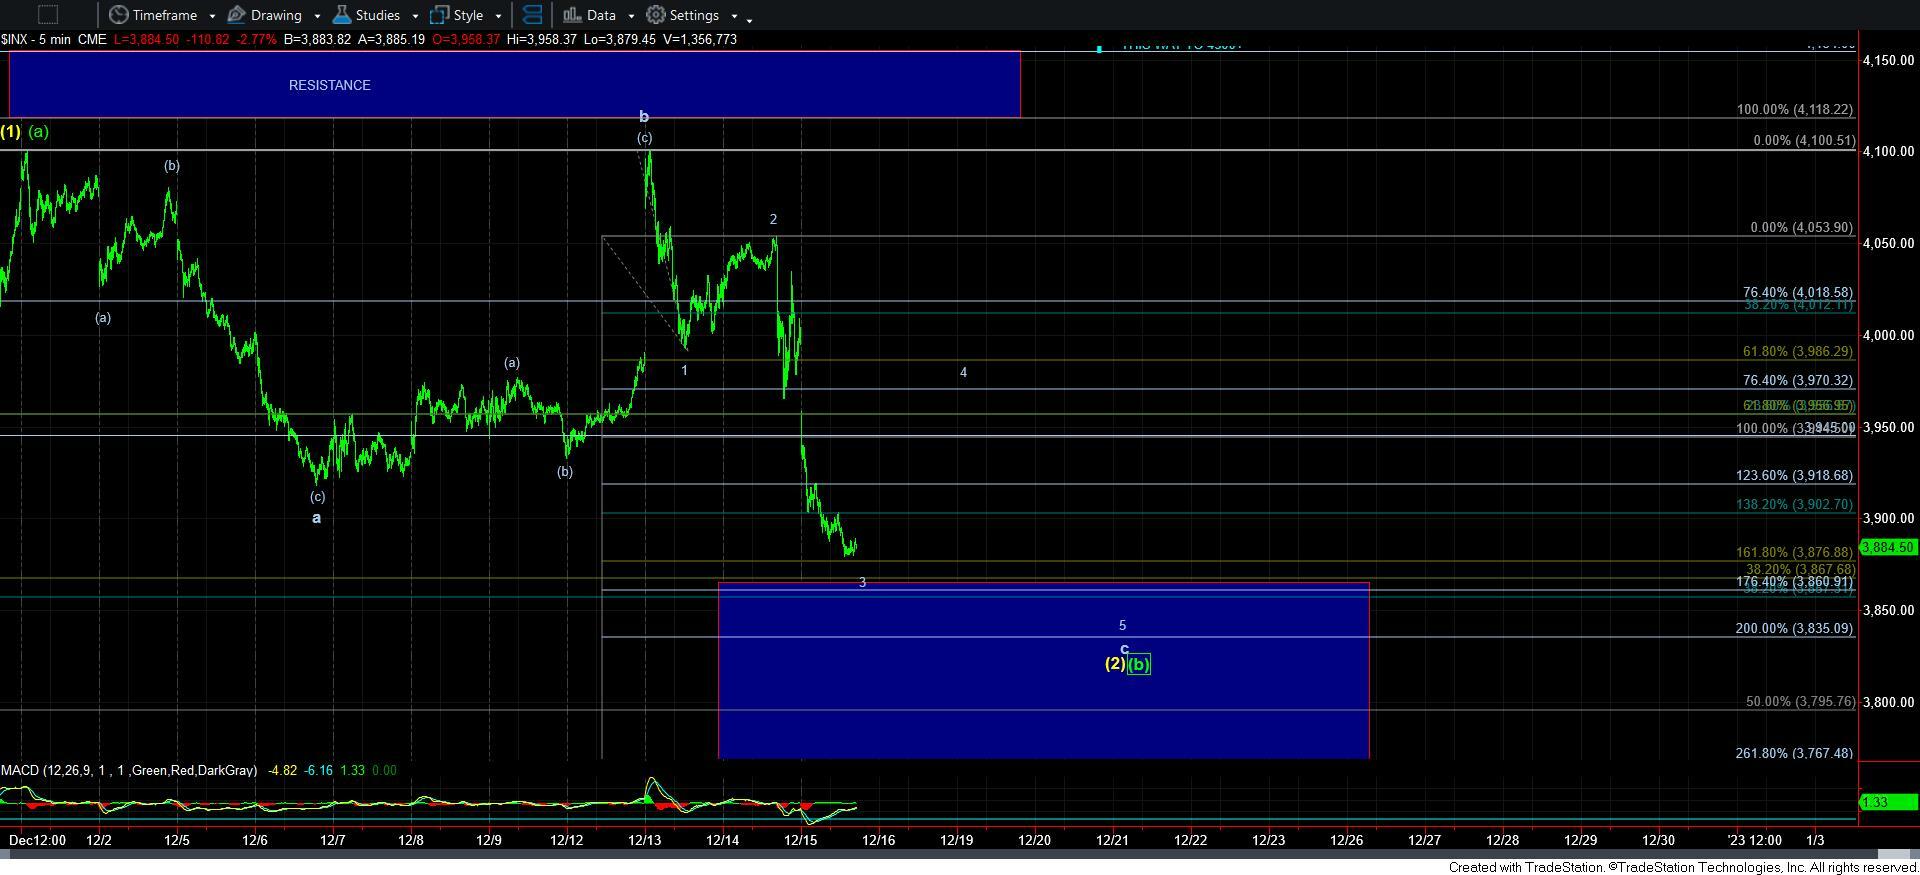
The other path is that the market is tracing out an ending diagonal for this c-wave. And, that is outlined on the attached 5-minute SPX chart. Should we see a strong and sustained move through the pivot on the 5-minute ES chart, then I will move into this count. But, please recognize that this pattern comes with a lot of whipsaw, as the structure takes shape as a-b-c sub-waves.
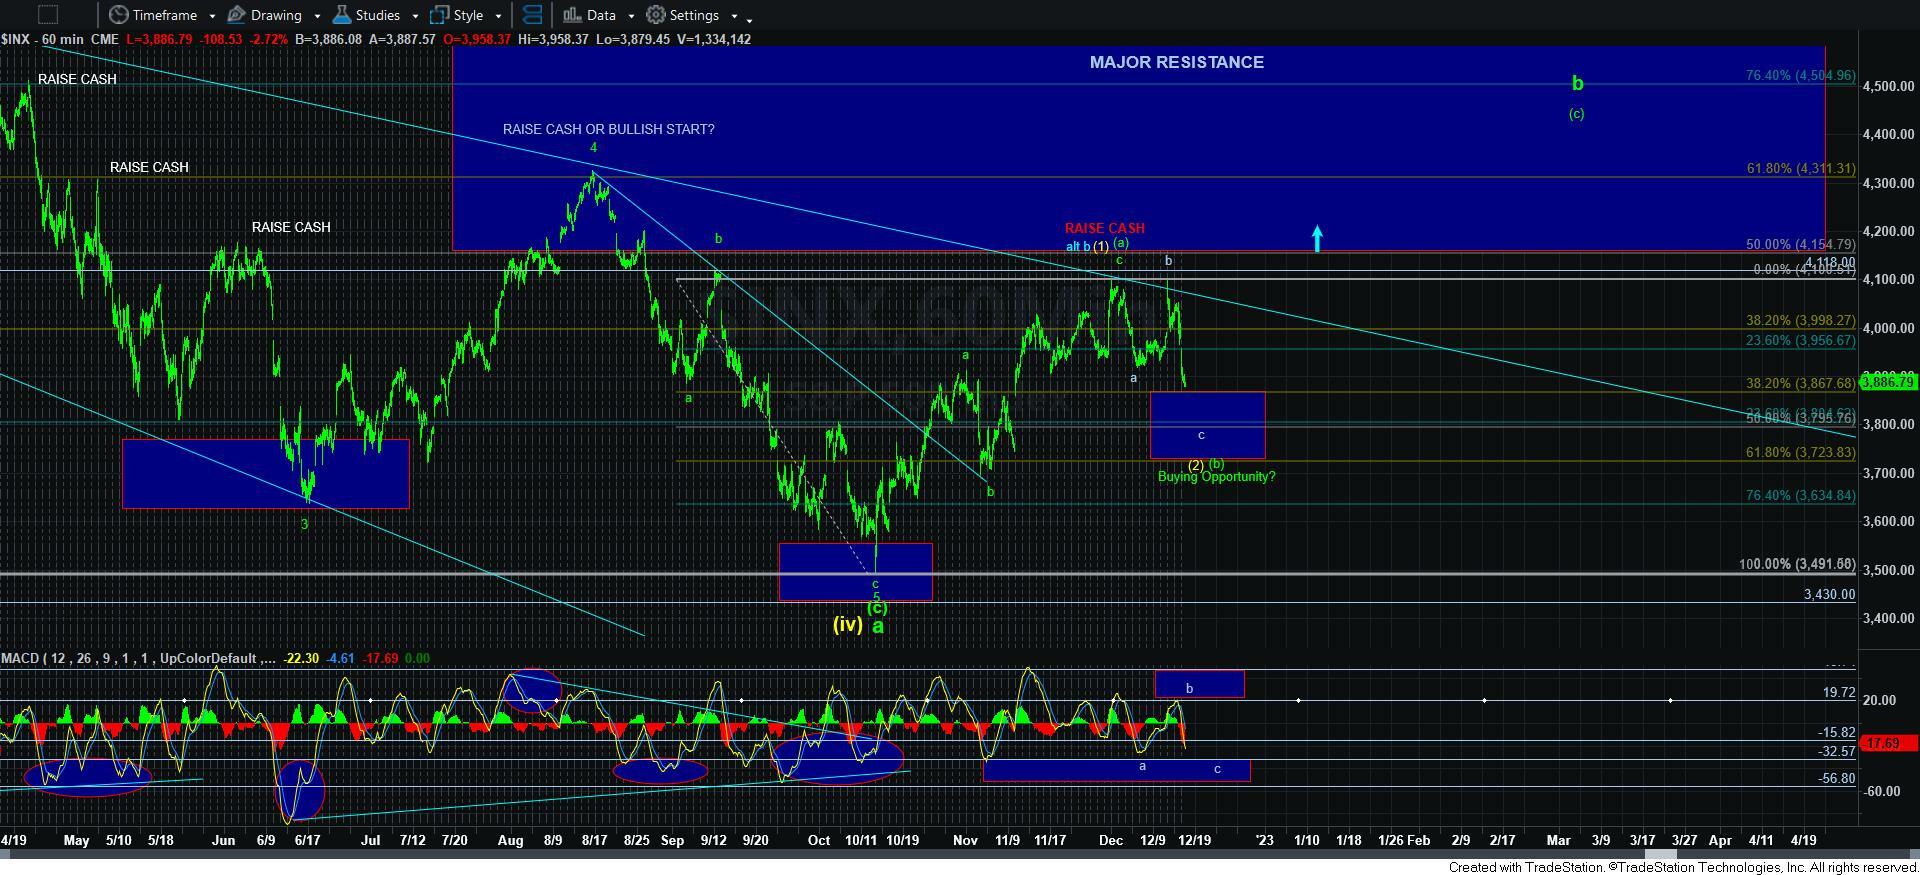
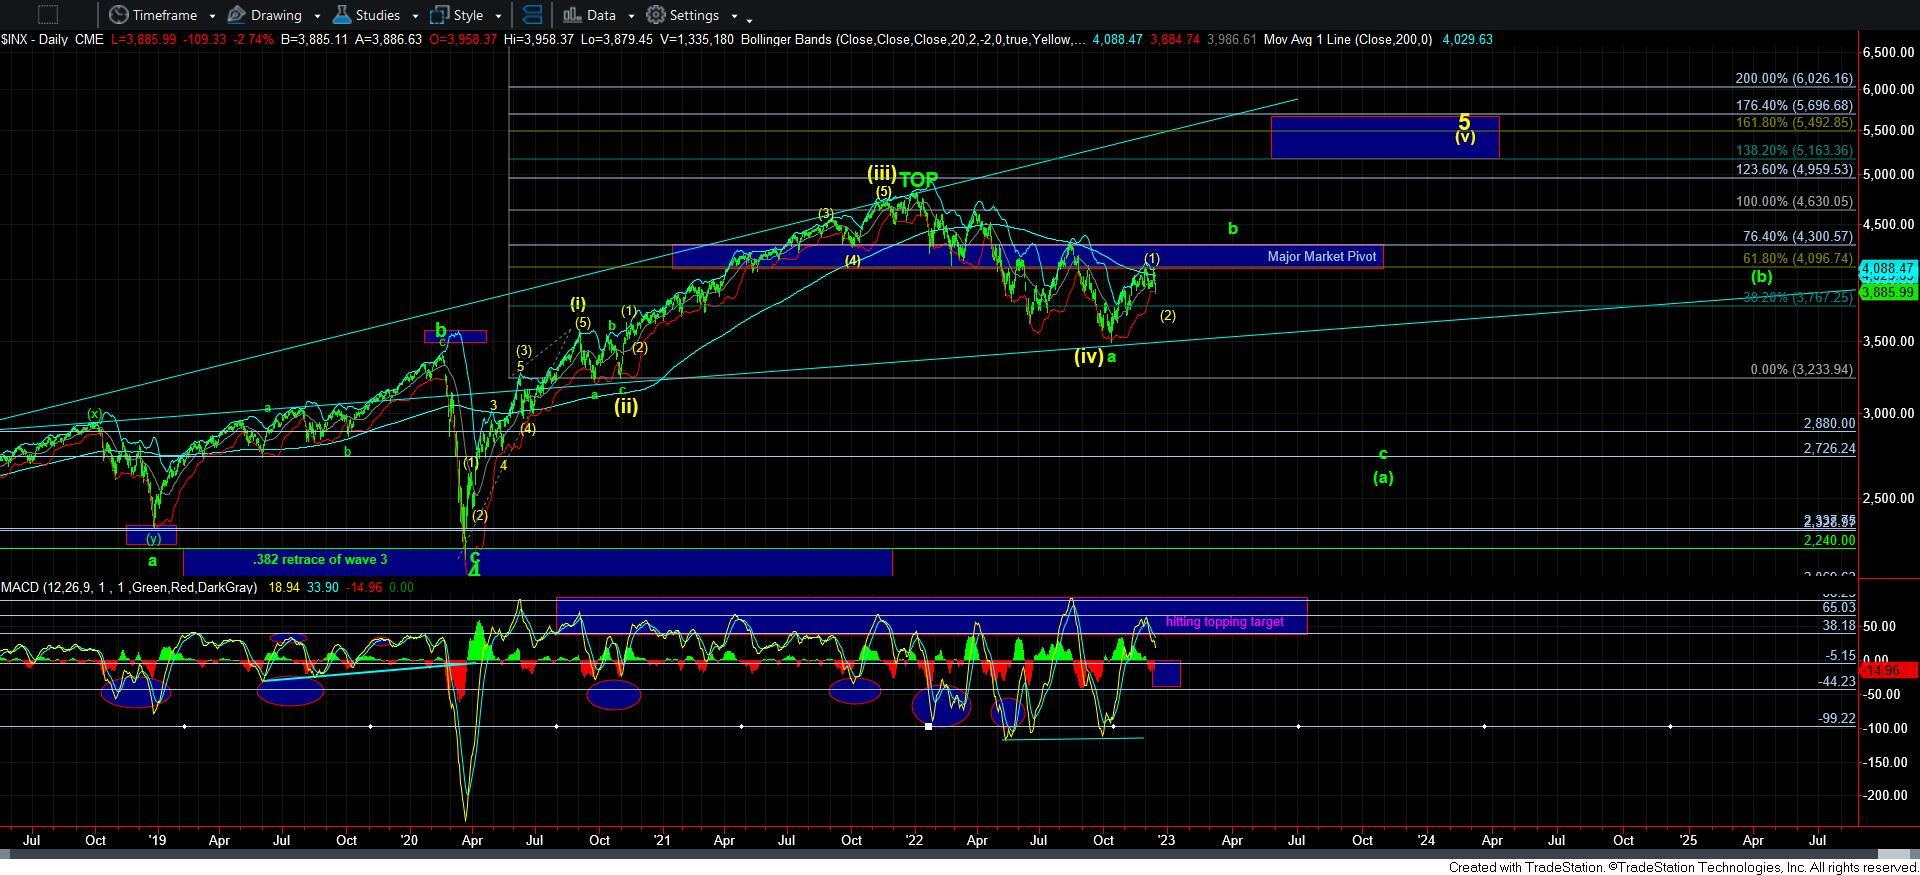
As you can see from the attached 60-minute and daily charts, the MACD’s are moving down to their targets. And, on the 60-minute chart, I am going to be looking for a positive divergence within this c-wave wherein the 5th wave price lower low will not make a lower low on the MACD, thereby providing us with a strong bottoming signal.
In summary, the market has now provided us with a strong indication that we are dropping down in the c-wave of an a-b-c corrective decline. As long as we continue to maintain this c-wave with appropriate proportions, it can provide us with a buying opportunity as this structure completes over the next week or so. All stops would be set just below the.764 retracement line on the 60-minunte SPX chart – but I may bring that up depending upon which structure completes the c-wave. The ending diagonal would likely bottom in the top half of our support box, whereas the standard impulsive decline would likely take us to the bottom of the box, or even slightly below.