Bulls Trying To Run With The Ball
While the market pulled back deeper than I really like to see yesterday, we did hold the .764 retracement. And, today, we have a seemingly strong bullish move right up to the 1.00 extension of waves [i][ii].
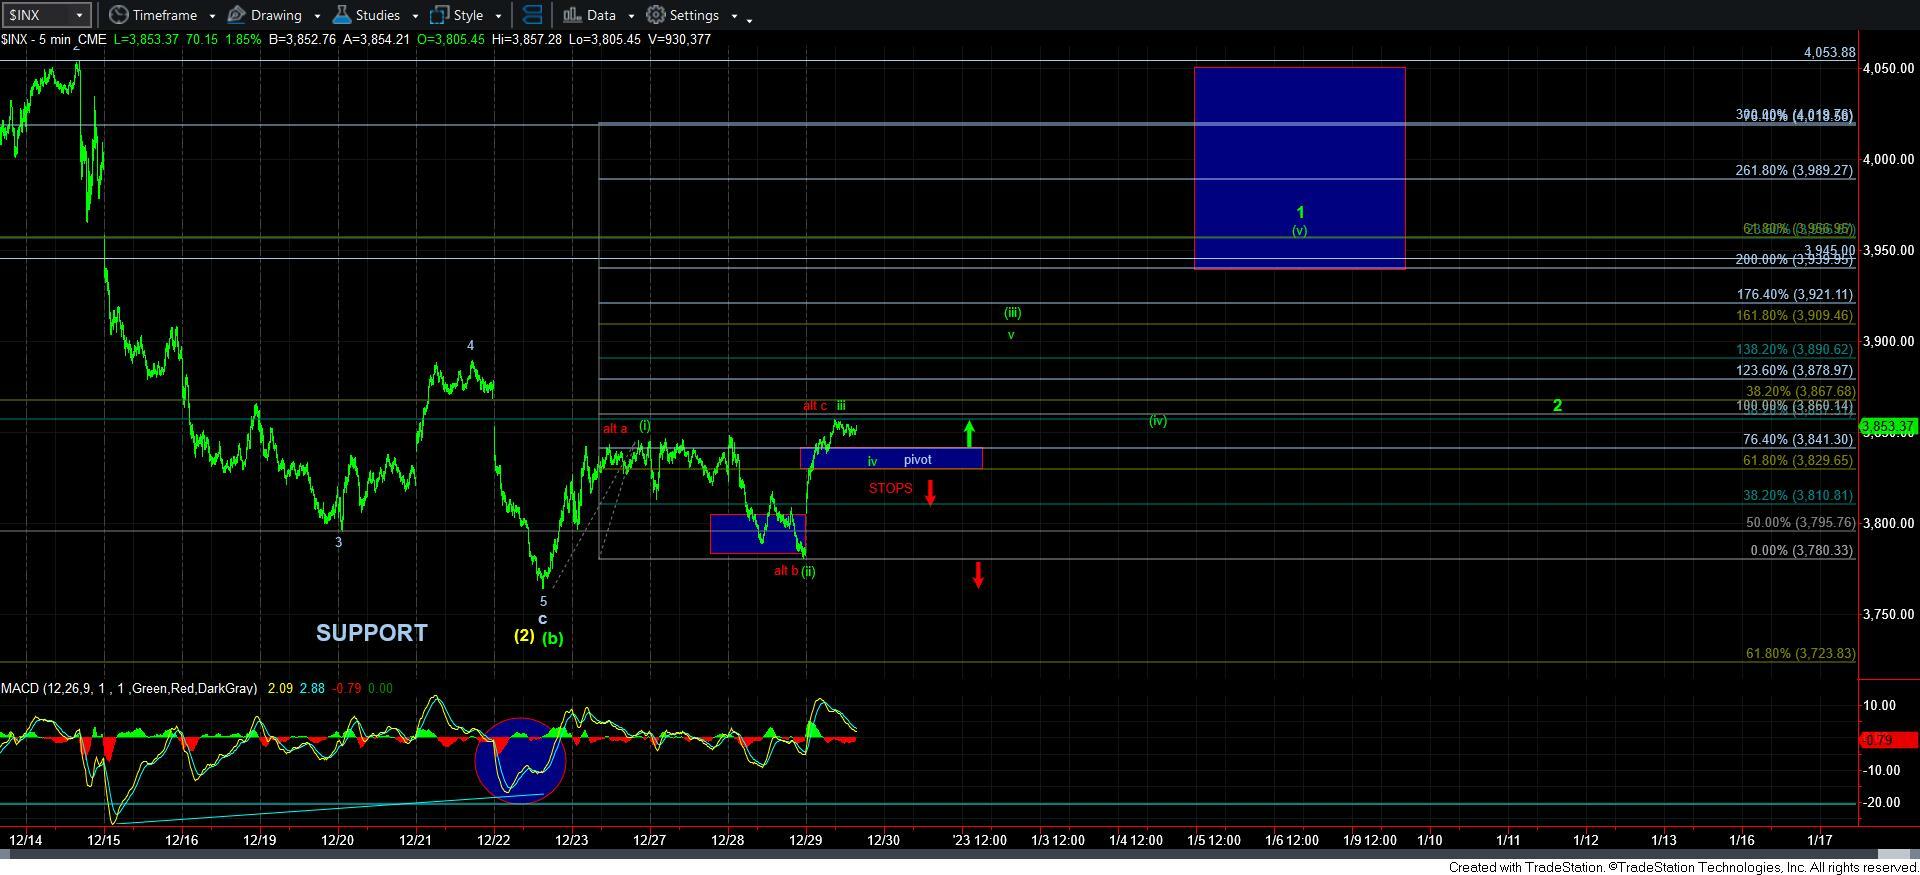
So, I think now is a good time to review our Fibonacci Pinball structure. When we have a [i][ii] set up, wave iii of [iii] targets the 1.00-1.236 extension of waves [i][ii], and wave iv of [iii] often pulls back to the .618-.764 extensions of waves [i][ii]. That is why I use the .618-.764 extensions as my pivot.
You see, should the market rally through the pivot, then it is clearly in wave iii of [iii] in the impulsive count. But, if we see a direct move without any clear i-ii structure within wave [iii], as we have today, it does concern me that the move to the 1.00 extension is an a-b-c corrective structure. And, this is where the pivot comes in. Once we move through the pivot to the 1.00 extension, and the market then pulls back to the pivot in corrective fashion and holds the pivot, it likely means it’s a wave iv pullback, and we will continue in wave v of [iii] to the 1.382-1.618 extensions of waves [i][ii].
However, if the market breaks the pivot, especially if it does so impulsively, it likely means that we only saw an a-b-c corrective rally, wherein a=c. While the minority of the time the market may resurrect to the upside, such as the case in a diagonal, the great majority of the time that the pivot fails to hold support suggests that the rally was corrective in nature, and we will continue to the downside.
So, as I noted earlier today, a direct move to the 1.00 extension on our SPX chart would concern me about a potentially bearish a-b-c structure, as shown in red. But, in order for me to adopt this alternative, the market would have to break down below the pivot in impulsive fashion, and then break down below yesterday’s low, which would then target 3720, but more likely the 3600SPX region.
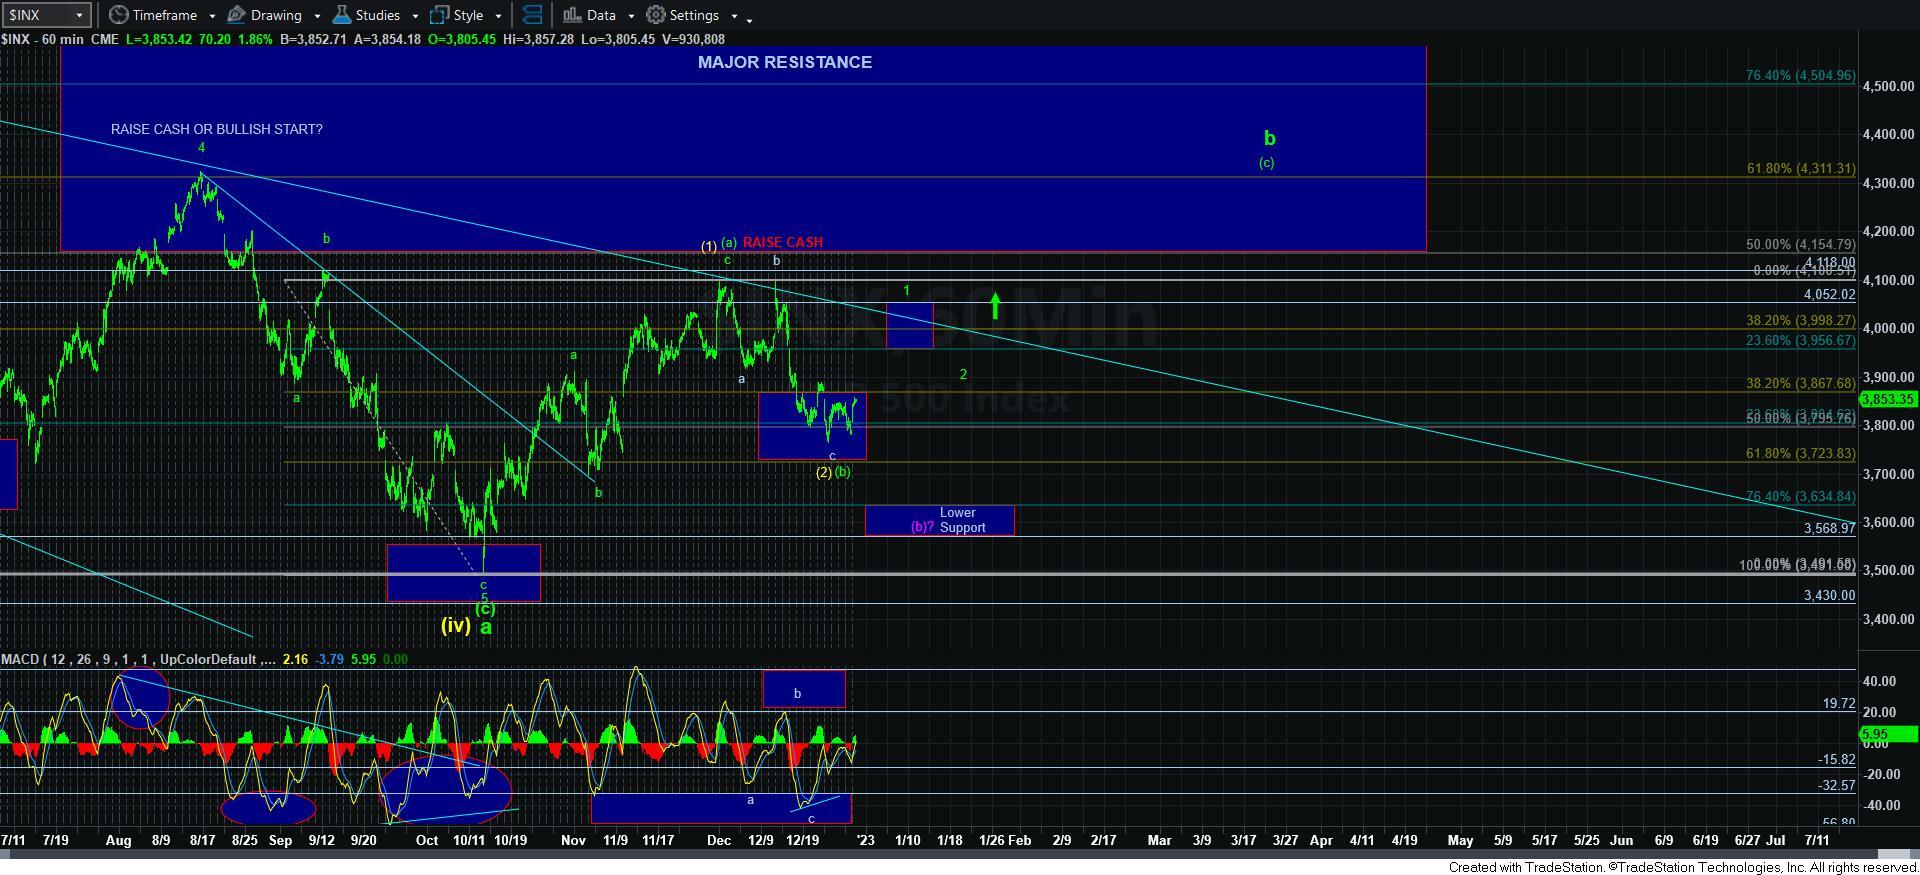
Yet, as long as we continue to hold the pivot and take shape as a corrective pullback, I can maintain my upside bias and continue to look for this wave 1 to complete waves [iii], [iv] and [v] in the coming week or so. Should that complete, it will likely suggest that we have begun the [c] wave rally to 4300SPX, even though we had a bit of a rocky start.
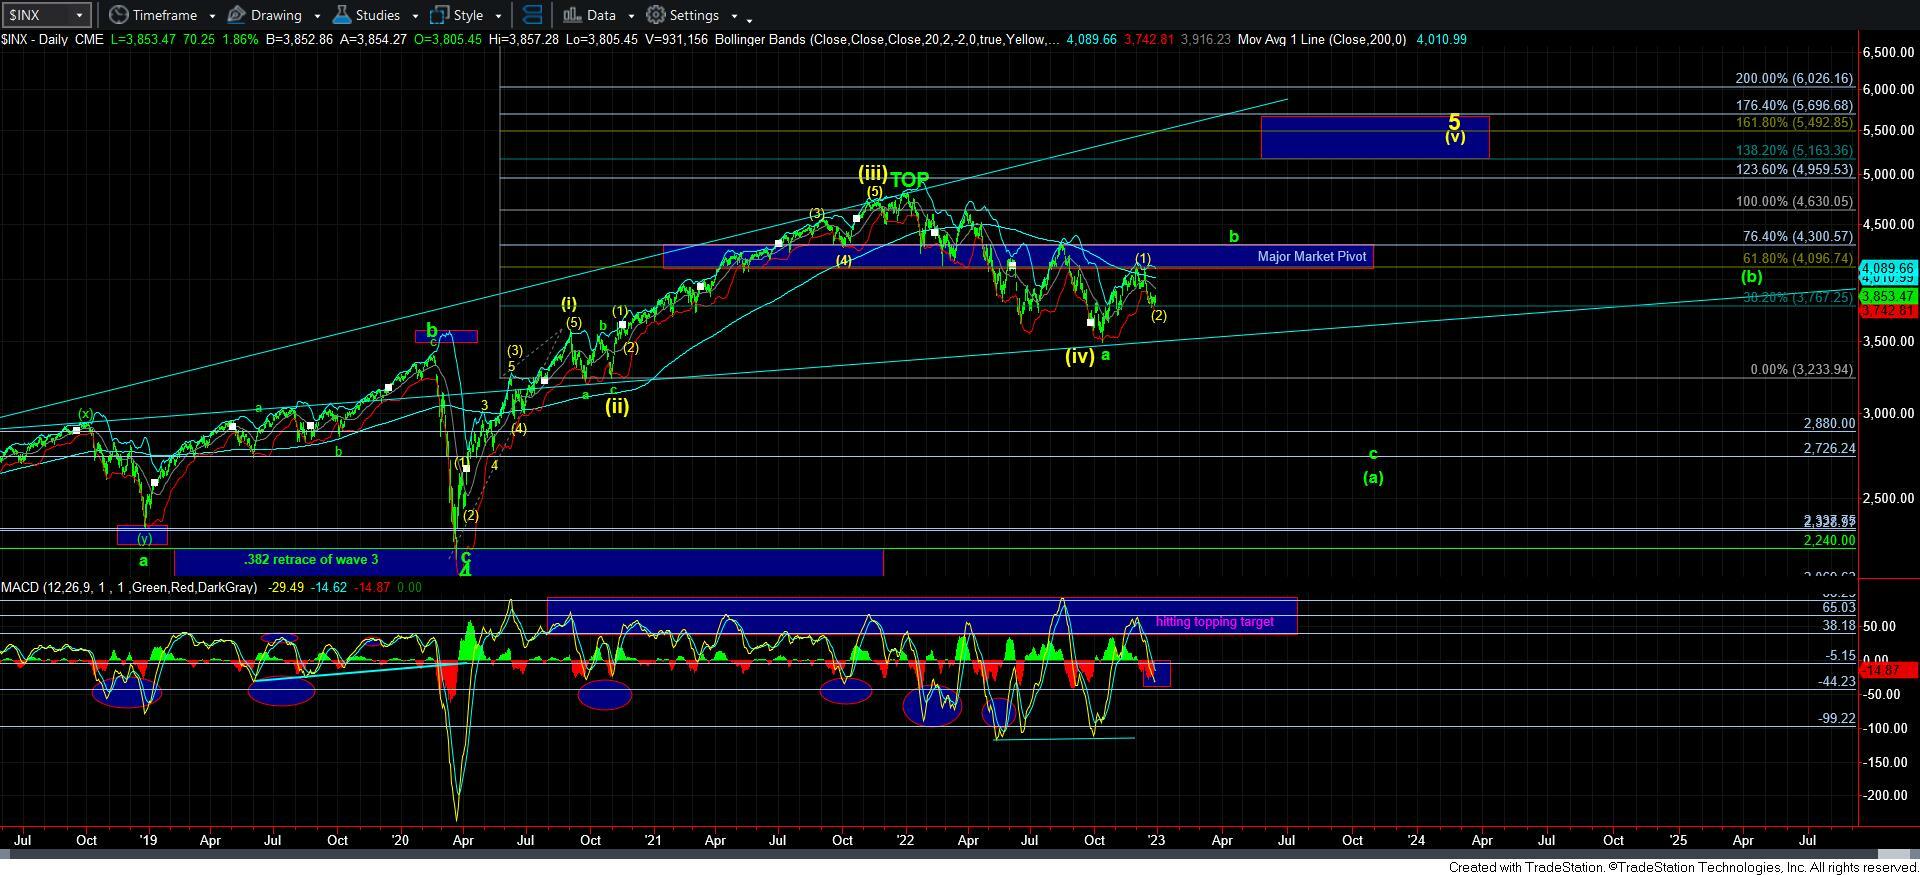
Moreover, as I noted in the trading room, should we complete that 5 wave rally, I am going to assume that the daily MACD will likely see a positive cross, which will also likely confirm that we have begun a [c] wave rally. As of now, we have dropped to the bottom of our target for the MACD, and the histogram is approaching zero. Furthermore, even the 60-minute MACD is trying to break out higher as we speak.
So, at the end of the day, price is the most important part of what we track. Therefore, how the market handles that pivot will be quite imperative to our determination regarding our ability to complete 5 waves up for wave 1 of the [c] wave to 4300SPX.
Should we break down below that pivot in impulsive fashion, then we will test the 3720SPX region, and most likely head down to the 3600SPX region in a larger degree [b] wave. For now, we seem to be holding the pivot. PLEASE know your parameters in this treacherous market and adjust your position accordingly to suit your own risk tolerance.