Bulls Still In Control
Earlier this morning, I wrote the following update to get everyone appropriately focused upon where we reside in the market:
Let's take a few moments to set our parameters in SPX based upon our Fibonacci Pinball structure. The bulls should be given the benefit of the doubt as long as we remain over this week's low, and I am going to interpret the chart from that perspective.
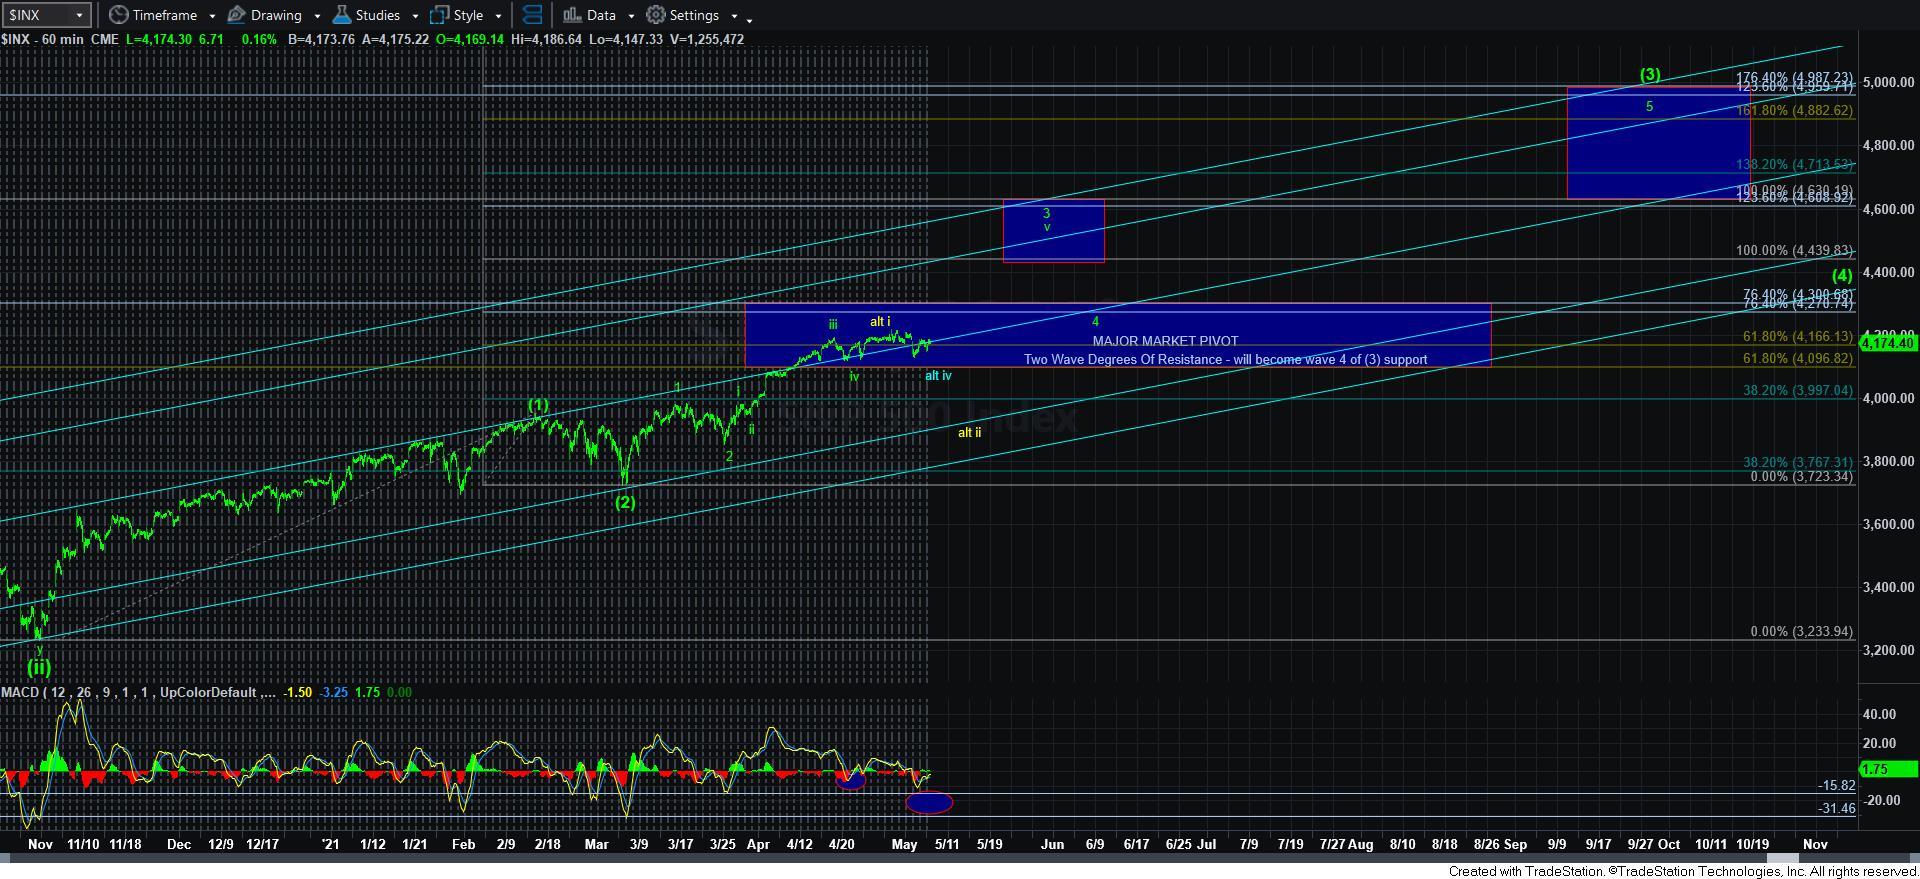
As we know, we are tracking a wave v of 3 with an ideal target in the 4400SPX region. That we can see from the 60-minute SPX chart.
However, we are also trying to track the structure which is going to take us there. If we assume last week's high was the top of wave [1] of v of 3, and this week's low the wave (2) of v of 3, we have seen a rally back up to just shy of the .618 extension of waves [1] and [2], which is what we can classify as wave [i] of [3]. Remember that wave [i] of [3] will target the .382-.618 extensions of waves [1] and [2] most often.
However, I cannot say that the rally we have seen off the low this week is a CLEAR 5-wave structure. I can certainly make an argument for that, but I don't have it clearly. Rather, I think we can even see one more push higher before wave [i] is completed.
Yet, another factor we consider within our Fibonacci Pinball structure is that wave [i] of [3] should not normally exceed the .764 extension of waves [1] and [2]. which in our case is the 4205SPX region. Therefore, if we see a direct move through the 4205SPX region, then the .618 extension (4190SPX) will become our micro support, and I will assume that wave [iii] of wave [3] of v of 3 is underway.
So, our parameters right now are 4205SPX region as resistance, and the low structure this week as our support. We need to break out over 4205SPX before we break below this week's low to keep bulls in charge and having us focused on the 4400SPX region again in the near term.
However, if we break below this week's low, then we will have to see if we do so with an impulsive structure. Right now, I have no clear impulsive structure to the downside suggesting that a c-wave down in yellow is in progress.
Not much has really changed in the analysis, other than the depth of the drop today forcing us to use the last rally off the intra-week low as a wave [1] in the more bullish immediate count.
I also want to note at this time that since this is a bull market, I am going to lean on the more bullish interpretations we are able to glean from the market action. Moreover, I would view any deeper than expected pullback as simply a better buying opportunity. But, the bulls have remained strongly in control this market since we bottomed back in March 2020, and they deserve our respect, which means it is reasonable to side with immediate bullish interpretations until the market tells us otherwise.
So, how can the market tell us otherwise now?
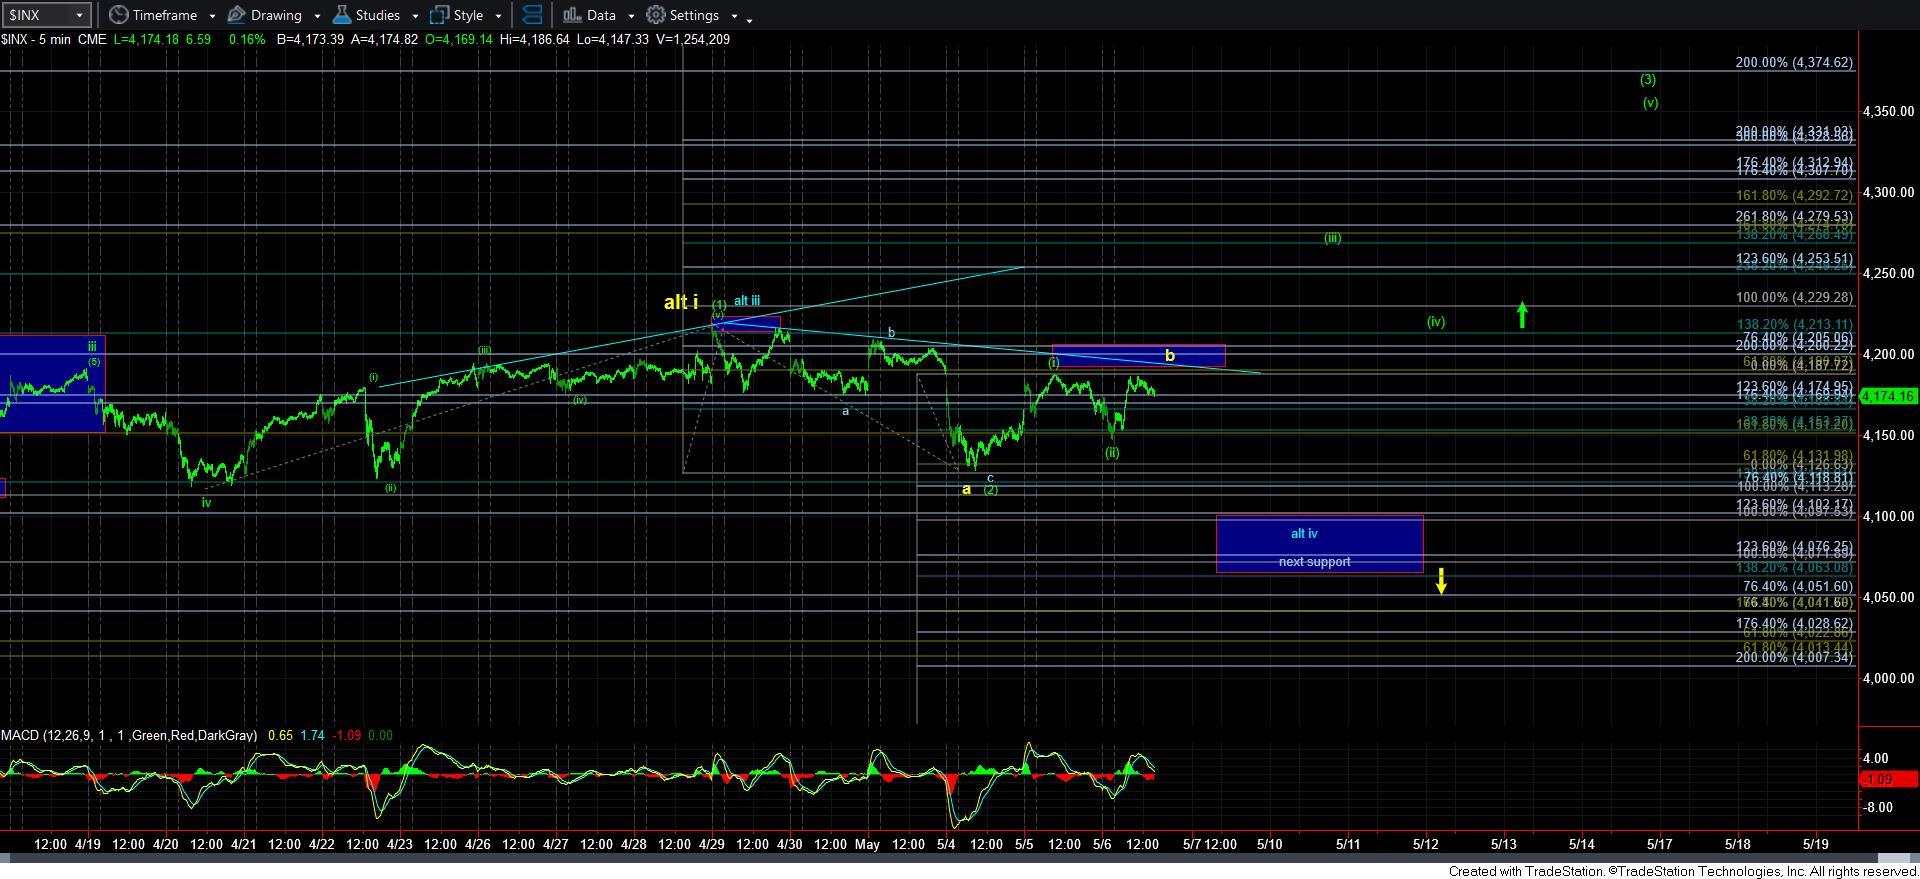
Well, as you can see from the 5-minute SPX chart, I have moved the b-wave over to the top of today’s rally, as we do not have a 5-wave decline structure to support is being at the last peak. In fact, after reviewing many factors today, I have a hard time adopting that yellow count, as I am really not seeing anything that can reasonably support such a deep pullback at this time. So, this will still be in the background for me.
In the meantime, after my review this morning, I think a more reasonable alternative is now presented in blue. This would suggest that the high we struck a little over a week ago is actually the top to wave iii of 3, with the action seen since then is all part of wave iv. This then makes our next lower support back in the 4070-4100SPX region. Again, I am not seeing much evidence of the market being able to break down below that support at this time, so if we break below this week’s low, then that is the region of support upon which I will next focus as our next buying opportunity should we break down this week.
So, in summary, today’s pullback low SHOULD hold on any further weakness if the market is following the most immediate bullish count. Moreover, we will need to break out over 4205SPX to make this a higher likelihood, which will then make our micro support at 4190SPX. This is presented by the green count on the 5-minute SPX chart.
Alternatively, should we break down below today’s pullback low, then the blue count begins to gain in probability, with the potential re-test of the 4100SPX region to be seen before we begin wave v of 3.
Lastly, I simply do not have enough evidence to view the yellow count as anything but a remote probability at this point in time. We would need to see a CLEAR impulsive decline begin with a 5-wave structure for me to consider this more strongly. Moreover, I would need follow through below 4070SPX to view us as declining towards the 3900SPX region in the yellow count. I am sorry for switching gears on this yellow count, but I just do not have sufficient evidence to adopt this at a higher probability at this point in time.