Bulls Smacked The Bears Today
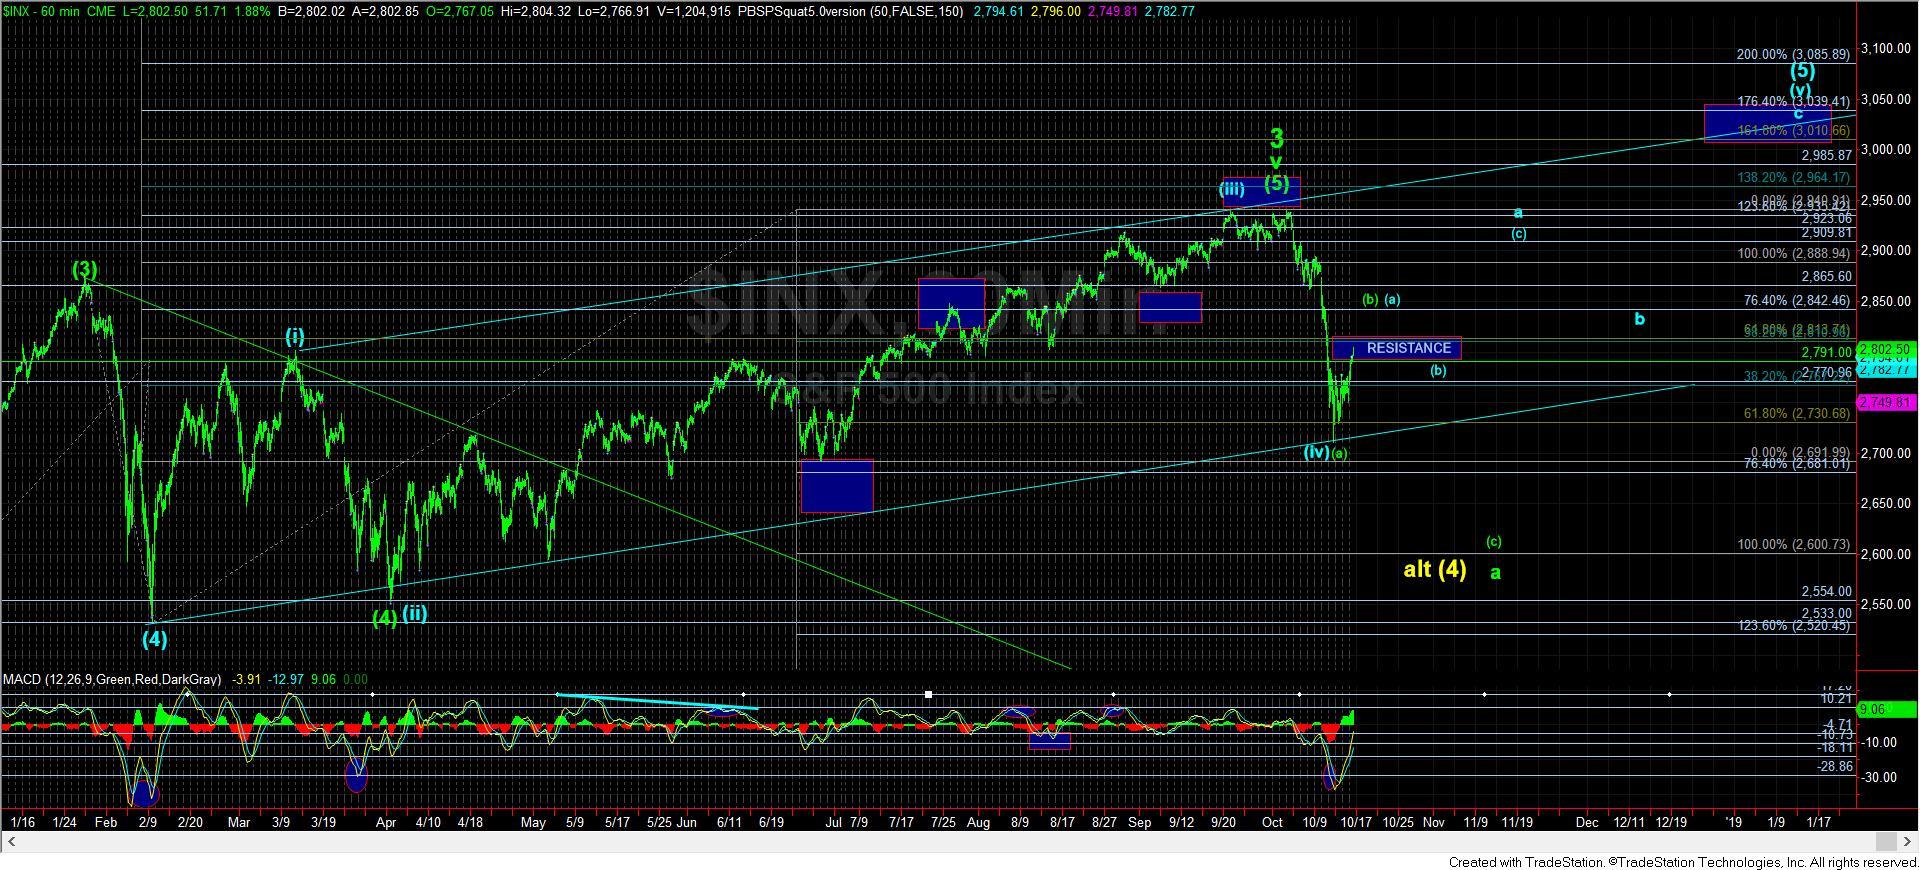
While the bulls seemingly smacked the bears today, if you pullback to the bigger picture on the 60-minute chart, you will see that we still have not even broken through resistance YET. That shows how deep a hole the bulls have found themselves within.
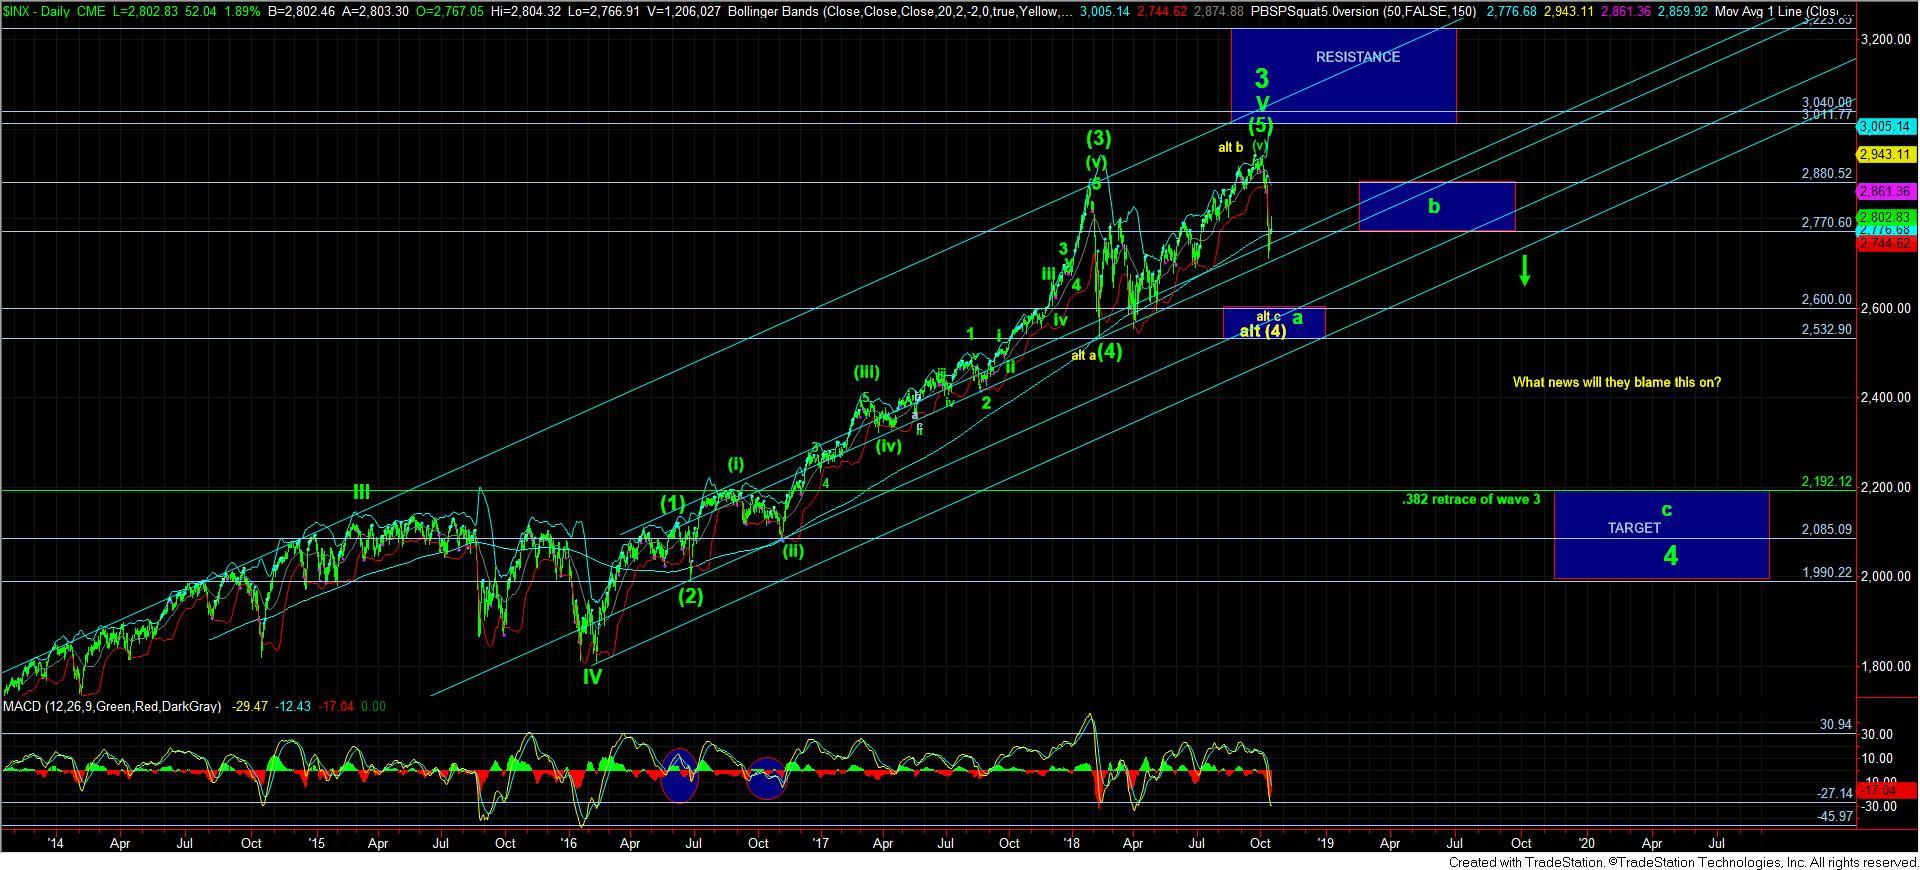
So, again, is 3000+ still possible for a 5th wave in a larger ending diagonal? Sure. But, as I noted today, the market has a very small hole to thread that needle:
“I don't do this very often, but, folks, I want you to take a step back for a second.
The market just broke a number of supports on its way down to its recent bottoming. Can it still get back to the ideal target region over 3000? Sure. But, I can assure you that most of the investors on this site would not likely be trading for it - and wisely so - because the risks to attain that last gain to 3000 directly from here are likely outweighed by the risk of having already begun wave 4.
Remember, when you put your money to work, you are always considering the risks vs. the reward. And, as I outlined in my weekend update BEFORE we broke down, trying to trade for that last gasp higher is often not worth the effort.
Currently, the market is testing the resistance region we have been consolidating under for the last 4 days. Unless and until it can actually take it out, I cannot even consider any potential for 3000+. And, even if it does take out resistance, there is a VERY small hole through which this market has to thread that needle to get to the 3000 region. That means the blue wave structure must PROVE it can pullback correctively and hold this resistance region as support IF - again, big IF - we are able to take out resistance.
Again, I personally view the risks as quite high in this region and most should be much more discerning of any long trades you decide to take. Remember, we have caught the rally from the 1800 region to the 2900 region. How much effort do you really think it is worth trying to get a POSSIBLE move to 3000 at this time?
Should I see something that makes me change my perspective, I will certainly put it out on an alert and update, and likely more than one. And maybe I would consider a rally from the blue b-wave corrective pullback to 3000 later this year if the set up should develop. But, for now, please recognize that the weight of evidence has shifted towards wave 4 on the larger degree charts.
I will now step off my soap box.”
At this time, resistance is still that - resistance. And, even if we are able to break out through resistance, the primary count would view that as the green (b) wave within the a-wave of wave 4. Only if the market would pullback correctively and hold this resistance region as support for the blue (b) wave would I even begin to consider any potential for 3000+ in the 5th wave of the ending diagonal.
As I noted before, there is a very small hole through which the market will be able to thread the needle to 3000+. And, even if it does, it will likely simply extend the point in time where we reach the 2600SPX region, as that is still my target for the a-wave of 4 even if we are able to get to the 3000 region to complete a bigger diagonal for wave (v) of (5).
At the end of the day, I still expect to see the 2600SPX region to complete the a-wave of wave 4. The question is from where we will see that drop. For now, my expectation is that we will not see the 3000 region – at least not until we see a successful test of this break out of resistance. But, I will retain an open mind should we be able to break out of resistance and continue to rally to 2840+SPX. But, even in that circumstance, the market will still likely come back to test this region from above, as once we break through resistance, that region becomes support which is then tested by the market. That is the (b) wave potential in blue. And, should that test fail, that tells us we are heading down to the 2600SPX region to complete the a-wave of wave 4 – even after a break out.
But, take note that the break out has not yet been seen.