Bulls Refuse To Give In
With the move up late yesterday, the bulls made it clear that they are not ready to throw in the towel. With the move through this week’s high, we have still maintained both potentials we have been tracking of late, with my primary still being that wave (4) has not yet completed. But, we no longer have an immediate set up pointing lower. We would need another smaller degree 1-2 downside set up to suggest that.
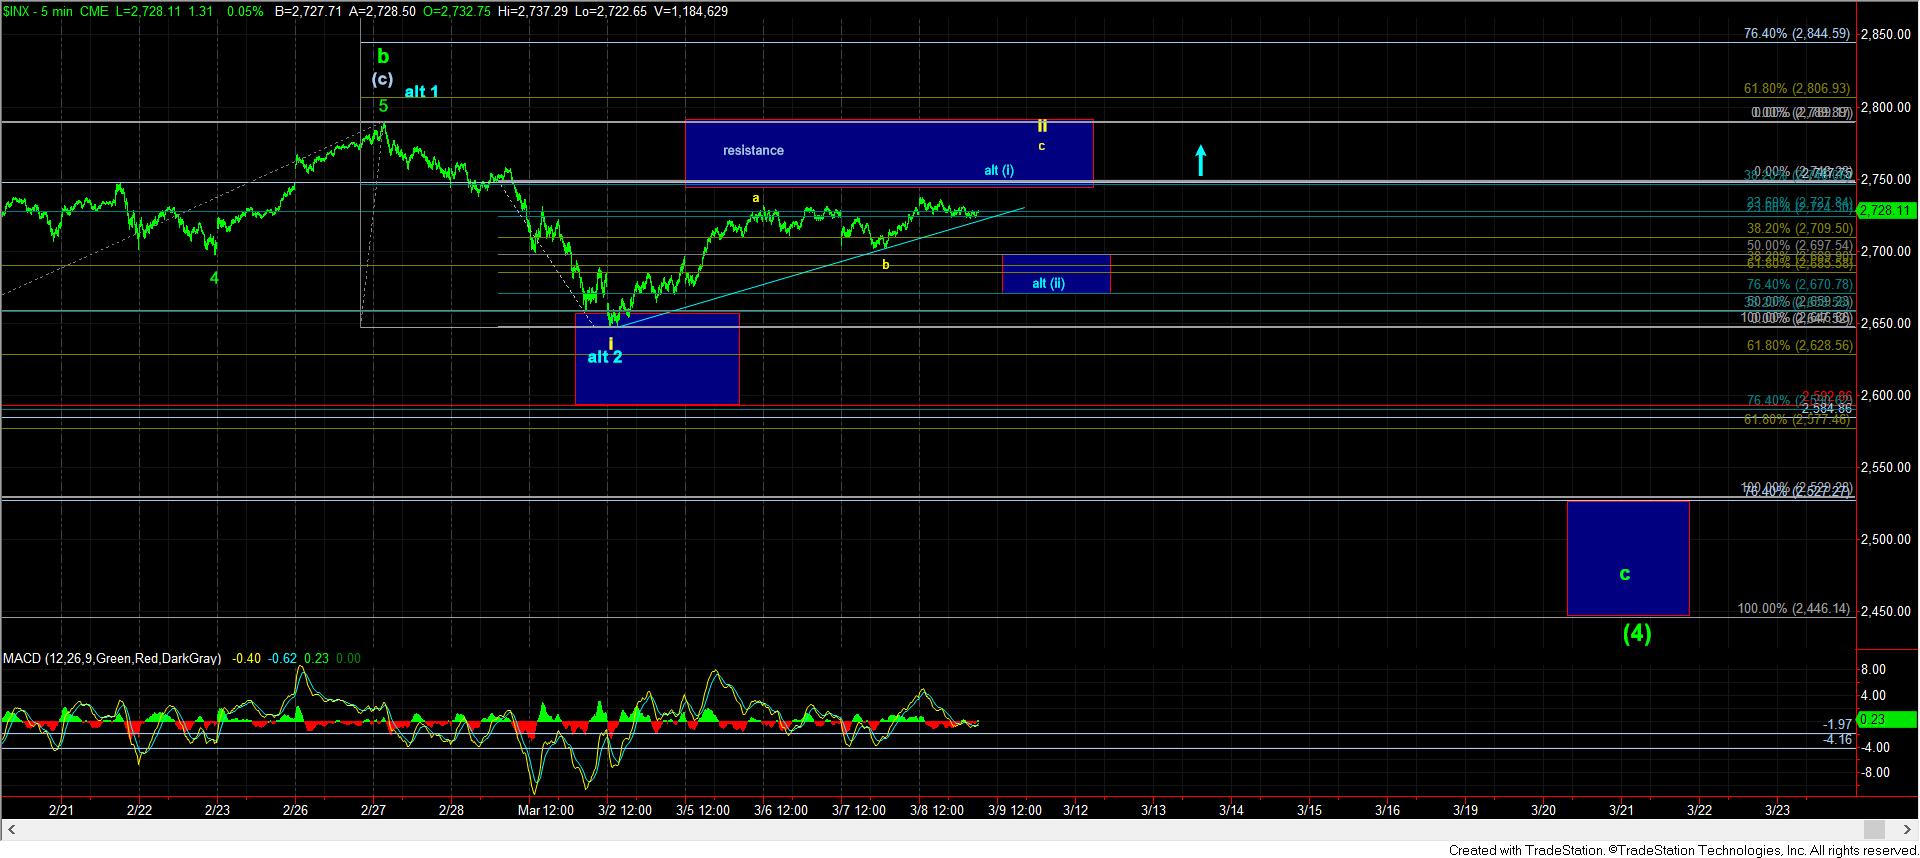
For now, until we break below 2700SPX, the market can retain the potential to push up towards as high as 2770SPX. But, a break below 2700SPX should begin to help us distinguish between the two potentials we have been tracking of late.
I want to also repost something I posted in the room earlier today, as I think it explains how I am viewing this region rather well:
I want to take a moment to explain how I am now looking at the equity market after this push higher overnight, and why the different patterns in SPX and ES make such a huge difference.
As you can see, a move up towards the 2750 region in the ES can provide us with an a-b-c rally, wherein the c-wave is equal to .764 times the size of the a-wave. So, if the market tops in that region, we have a reasonable I-ii downside set up pointing down towards the lower box for wave (4) on the 5-minute SPX chart.
However, if you also look at the 5 min chart, a top in the 2750 in the cash index would provide us with a potential 5 wave structure where the 5th wave of wave (i) would be a textbook size for an impulsive rally off the March lows.
When we have a situation where the SPX and the ES provide us with different perspectives, it certainly provides us insight of how the market can hide its true intention of what it may do in this region.
And, again, the way we will be able to distinguish between the blue more immediate bullish count and the bigger wave (4) is going to initially be how the market drops off any high it makes in this region. If the move is CLEARLY an impulsive 5 wave structure, it keeps us strongly in the primary count for a bigger drop to at least the 2600 region (if this turns into a triangle), with the potential to drop towards the ideal target for the wave (4) in the 2440 region.
However, I have now added a blue wave (ii) support box, with the assumption that we top in the 2750SPX region. Again, I have no confirmation of this potential, but I am using it for illustrative purposes for now, and will adjust when we see how the market develops in the coming days.
Alternatively, a break out through the 2755SPX region opens the door to the 2770SPX region, and would make the blue count that much less likely, as long as we remain below the 2789SPX region. That type of rally would make it much more likely that we are dealing with an a-b-c structure rather than an impulsive structure off the early March low – as long as we remain below 2789SPX.
So, it would seem that the market is going to take a bit longer to provide us clues as to whether wave (5) to 3000+ is in progress or if we have more downside work before we complete wave (4). For now, I still remain in the wave (4) camp, as long as we remain below 2789SPX, and as long as the blue count does not trigger as presented on the 5-minute SPX chart. And, even while I maintain a primary expectation for further wave (4) action, I have parameters as to when that becomes a much lower probability, and I have outlined that in this write up.