Bulls Have A Very Small Window
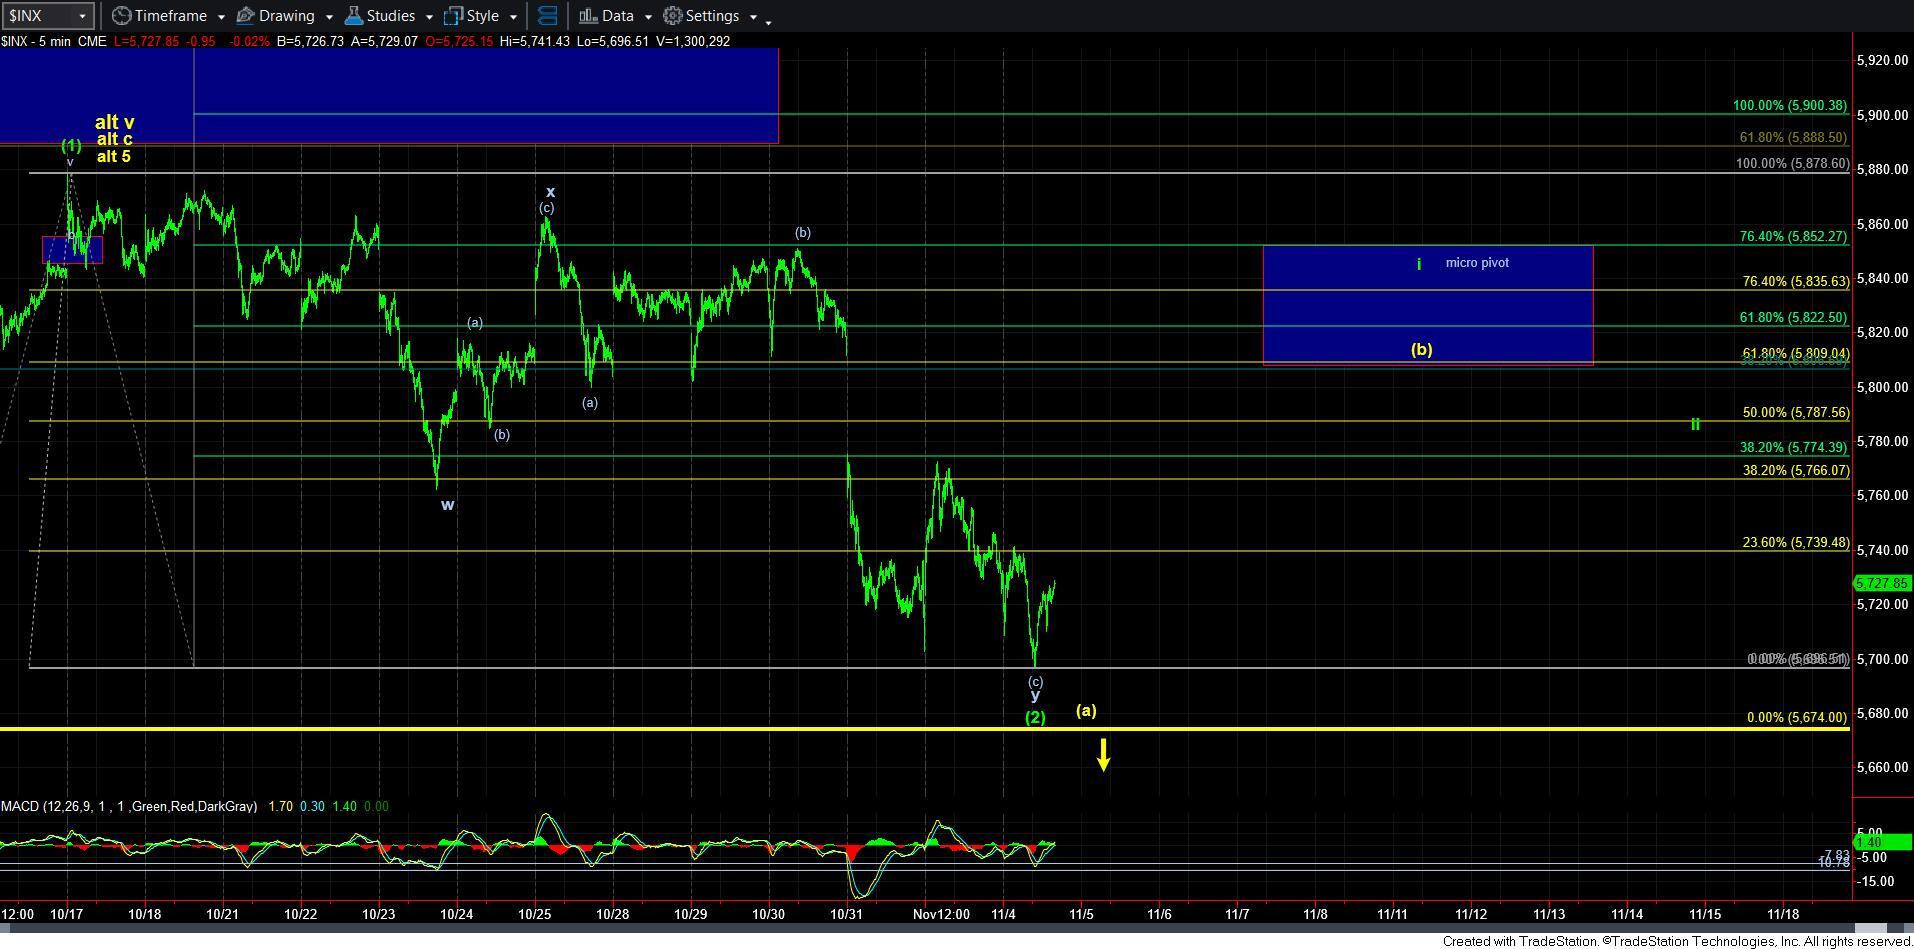
As the market continues to meander, we saw a slightly lower low today, and seem to be getting closer to the 5674SPX support level. However, as I noted before, in breaking below the .764 retracement, the probabilities of this being a wave [2] pullback are certainly dropping. However, I am not ready to completely abandon it until we actually break that level.
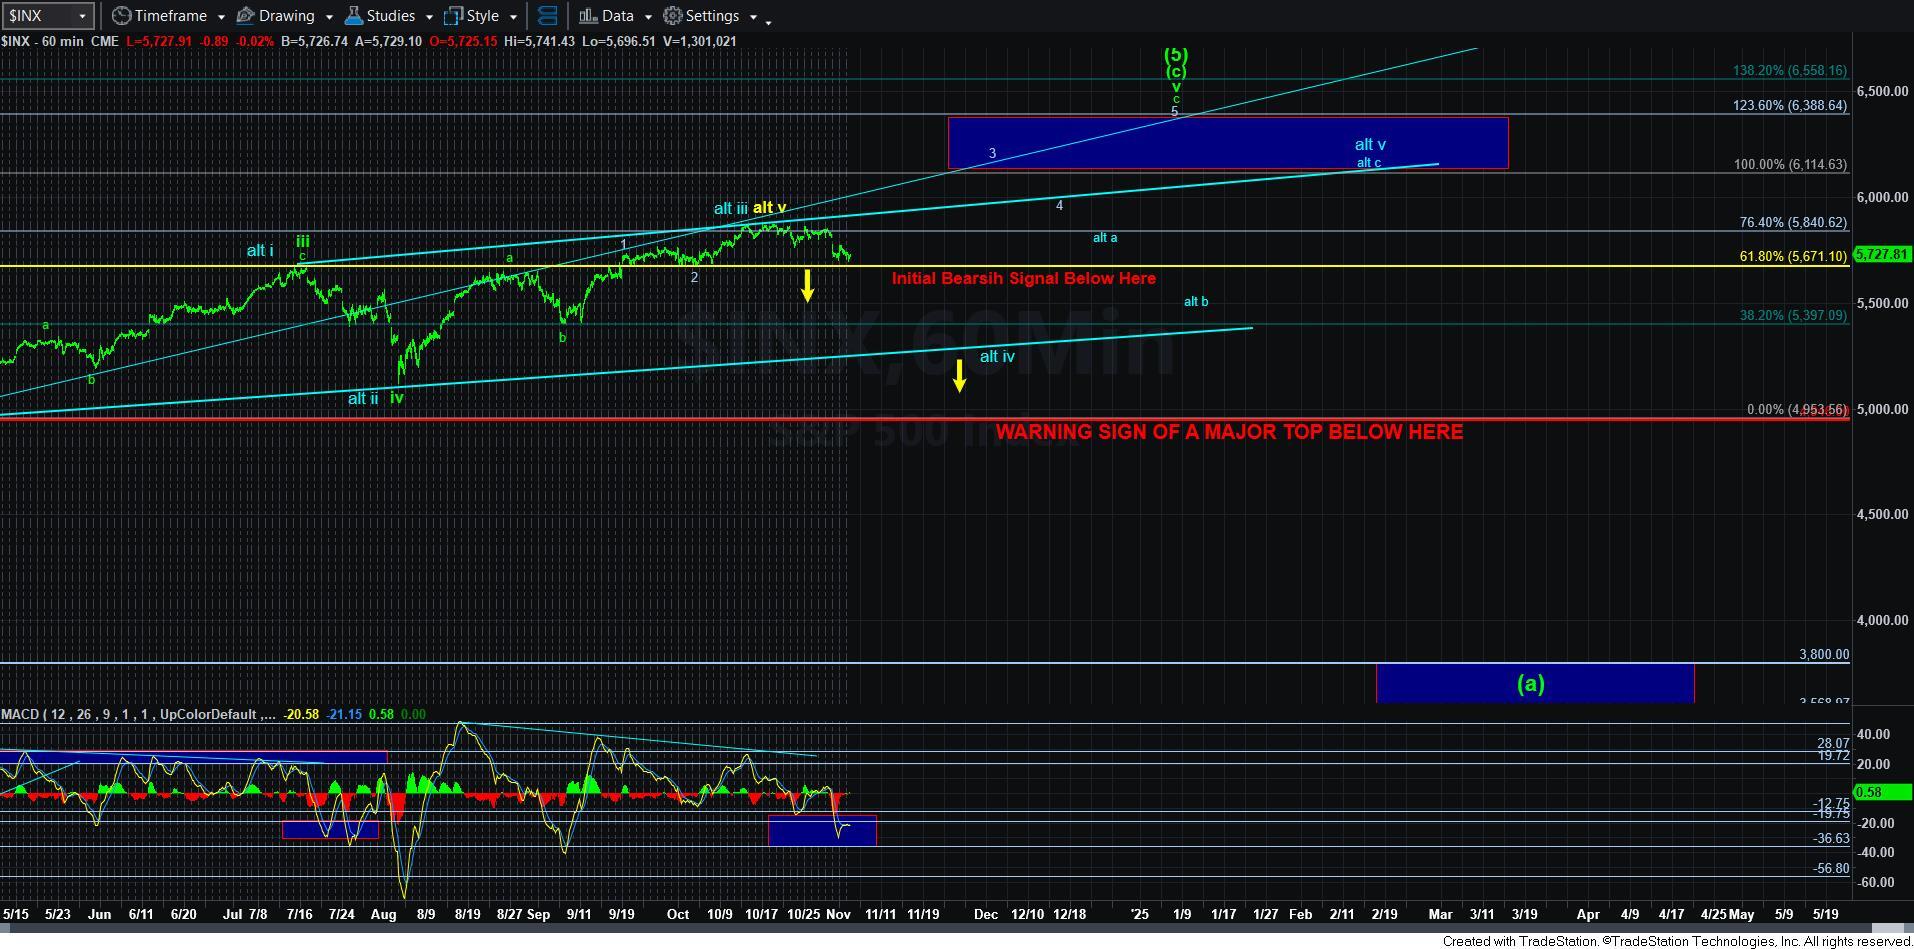
In the meantime, I am also tracking the yellow count, which ideally would view this decline as an [a] wave. As an aside, even though I am calling it the yellow count, until we actually break down below the 5300SPX region, the yellow count also aligns with the blue count I discussed over the weekend, which is outlined on the 60-minute chart. But, assuming that we are completing the [a] wave, we should be able to see at least a [b] wave bounce.
Now, if you hear some questioning in my writing regarding this already being the completed [a] wave, then you have read between the lines quite well. You see, the structure of this decline has not provided us with a clear 5-wave c-wave, so I am basing my view on a reasonable assumption. It is still entirely possible that the [a] wave can extend below the 5674SPX region if we see a more direct break of that level.
But, in summary, nothing much has changed. As long as we remain over 5674SPX, I have to give the bulls the benefit of the doubt and the opportunity to provide us with a 5-wave rally for wave i. Should they fail to do so, then we will switch gears and begin to look down to the 5300-5400SPX region for the next alternative as presented in blue.
In the meantime, I have noted the retracement levels on the 5-minute chart for the yellow count in yellow, whereas the extensions of the [1][2] structure is presented in green. And, resistance is being represented by the micro pivot overhead, which begins with the .618 retracement of the [a] wave decline.


