Bull’s Big Test
On Monday, the bears had an immediate downside set up fall out of their hands, which caused them to fumble the ball. The bulls picked up the ball, and ran it up to the 1.236 extension today, and have now pulled back into the support region noted on our charts. Will the bulls hold onto the ball?
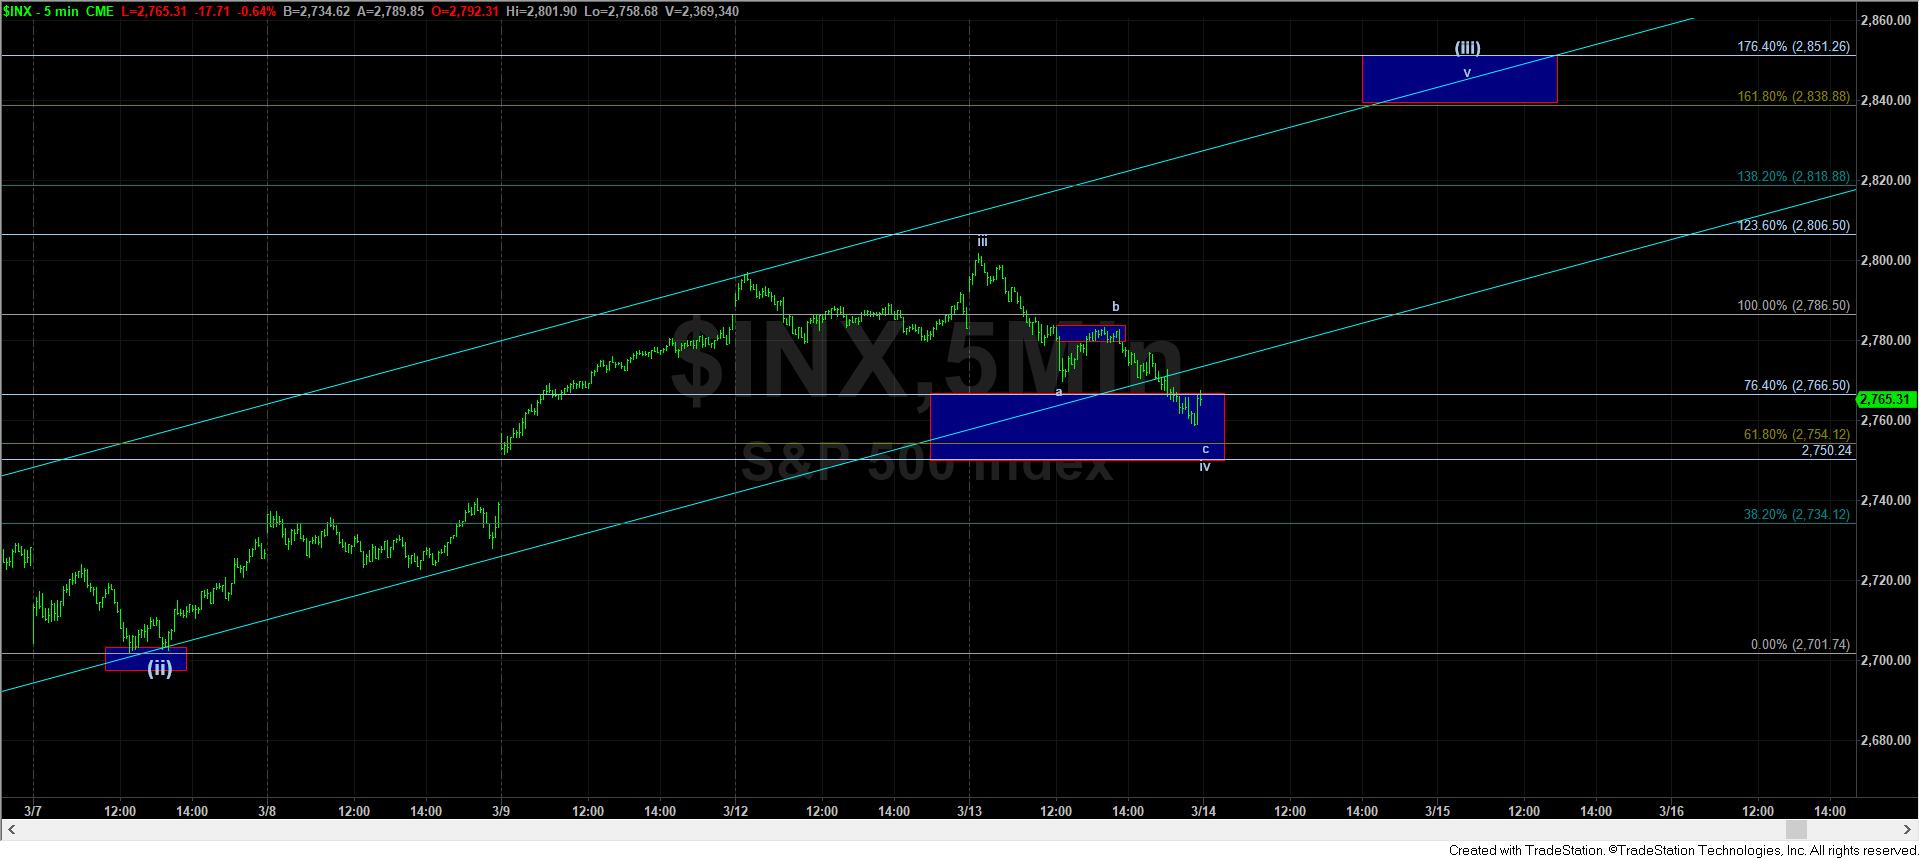
You see, if both the bears and the bulls are unable to hold onto the ball, it suggests that we are still in an ongoing whipsaw/corrective pattern. But, thus far, the bulls are holding onto the ball, as long as we do not break below 2750SPX.
The reason I now view 2750SPX as key (as opposed to the slightly higher 2754SPX) is because we have an a=c structure right down into that support. As long as support holds, we still have targets of at least 2819SPX, with the preferred target still being in the 2840-2850SPX region next.
However, if 2750SPX support breaks, then it suggests that the bulls have also fumbled the ball, and this corrective action can continue, and still take us much lower. In fact, if we see a 5-wave structure develop off today’s high that takes us down to the 2715-20 region, that would strongly suggest the bears are back in control, and one can choose to short the following bounce, as we are likely heading down to at least the 2600SPX region.
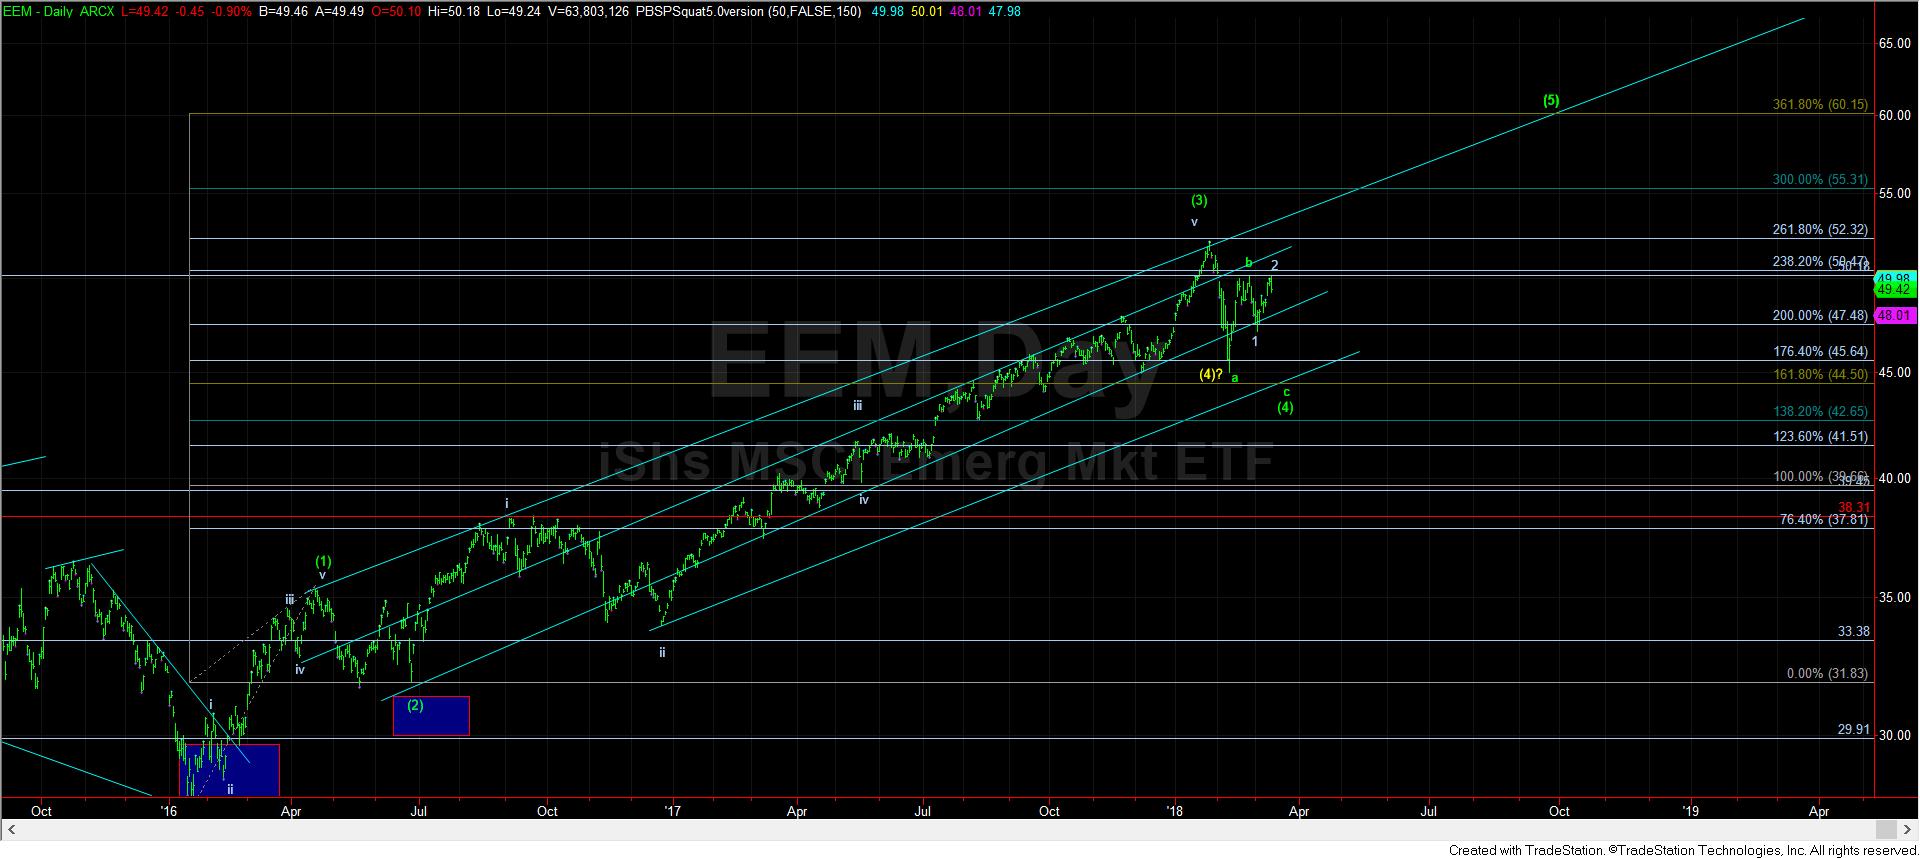
I also want to point out the conundrum we have in the various charts we follow. Let’s start with the EEM, which also has a similar pattern to the DOW. Today, it came within a penny of invalidating its immediate downside set up. As long as it did not exceed the 50.18 level, it has an a-b-c structure in place, with a 1-2 downside set up which invalidates over 50.18. Today, it held that level to the penny.
However, even though I am not posting a chart on the Nasdaq, I want to at least note that it has come up too high to maintain a strong bearish perspective, as it seems it has likely completed its corrective pullback in wave (4). And, while the other indices may drop, it is much less likely that the NQ will see a lower low, but it may pullback in a larger degree wave 2.
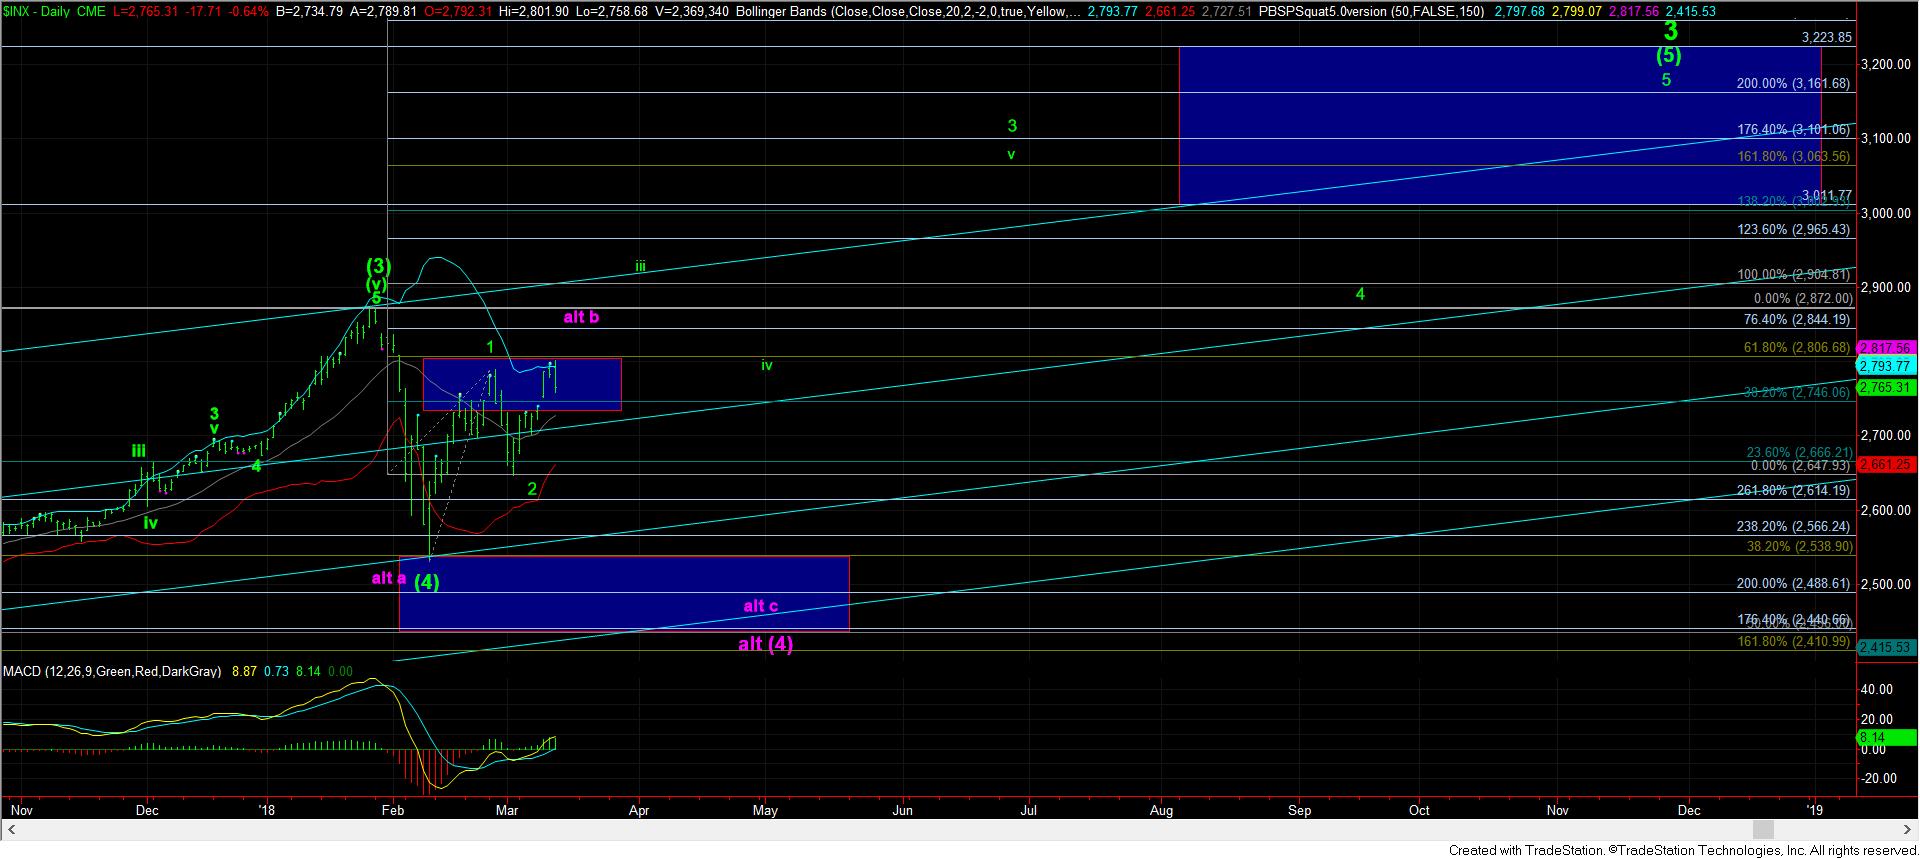
This leaves the SPX right in the middle, as it can still provide us with a bigger wave (4) should it break down below 2750SPX.
For now, I have to maintain a bullish bias as long as we hold 2750SPX. And, clearly, a break down below 2750SPX which provides us with a 5-wave structure off today’s high will give me my “Gartman-moment,” which is what I feared in my weekend update. But, as long as we hold 2750SPX, the bulls should still be able to hold onto the ball and take us up over 2800SPX later this week.
But, please maintain the bigger perspective at all times. The market still seems to be targeting the 3011-3223 region later this year. We are simply sorting out how we get there, and whether we have begun that rally, or if we need one more bigger pullback before that rally begins. Again, as long as we are over 2750SPX, we can view that rally as having begun.