Bulls Are Weakening - Market Analysis for Oct 31st, 2019
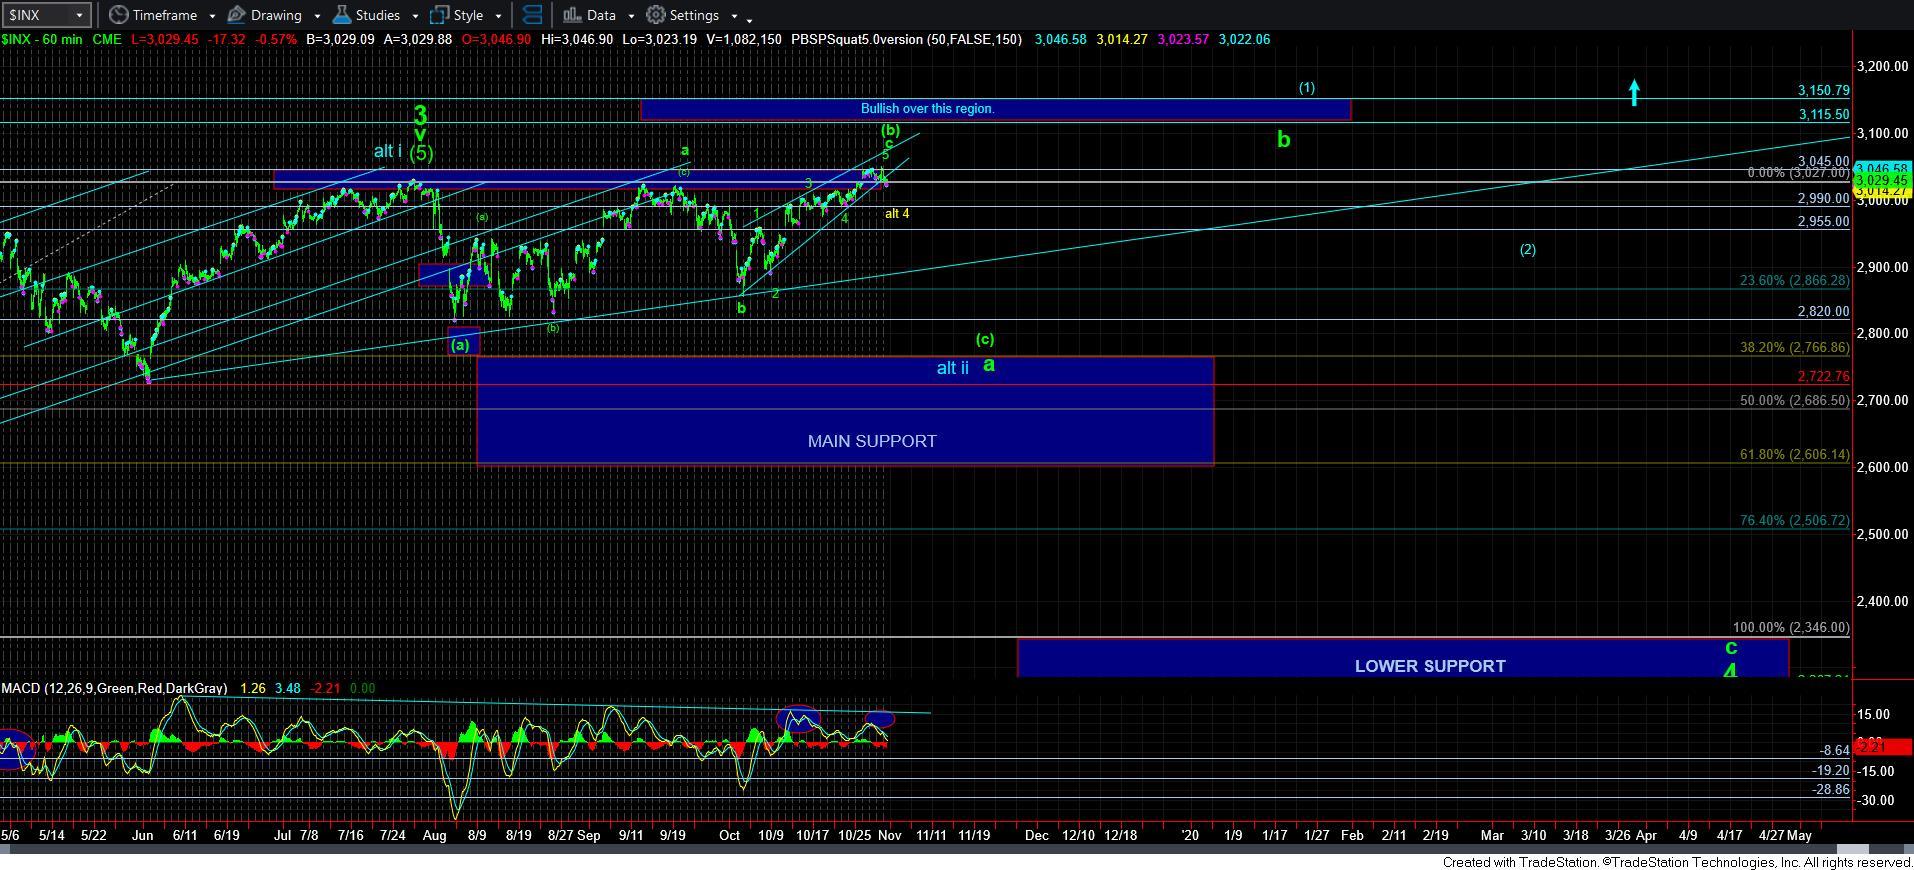
With every drop in price, the technicals evidence further weakening to this uptrend. As you can see from the 60-minute charts attached, the MACD’s have been evidencing less and less momentum with each push higher in price.
Ultimately, we get to a point when the market can no longer push higher as it has run out of buyers, and the selling begins. Whether we have reached that point will likely be determined by what the market does at lower levels of support. But, for now, with the NAAIIM Money Manager Exposure Index at 89, up from 66, we are getting more and more evidence that the upside is becoming more and more limited.
For now, I am still looking for a test of the 2970/90 support region. And, the structure of the market as we head down into that region will likely give us more clues as to whether we can still push to a higher high or not. As I write this, we are still very much in no-man’s long, but a sustained break down below 3030 will have me looking down to that support region next.
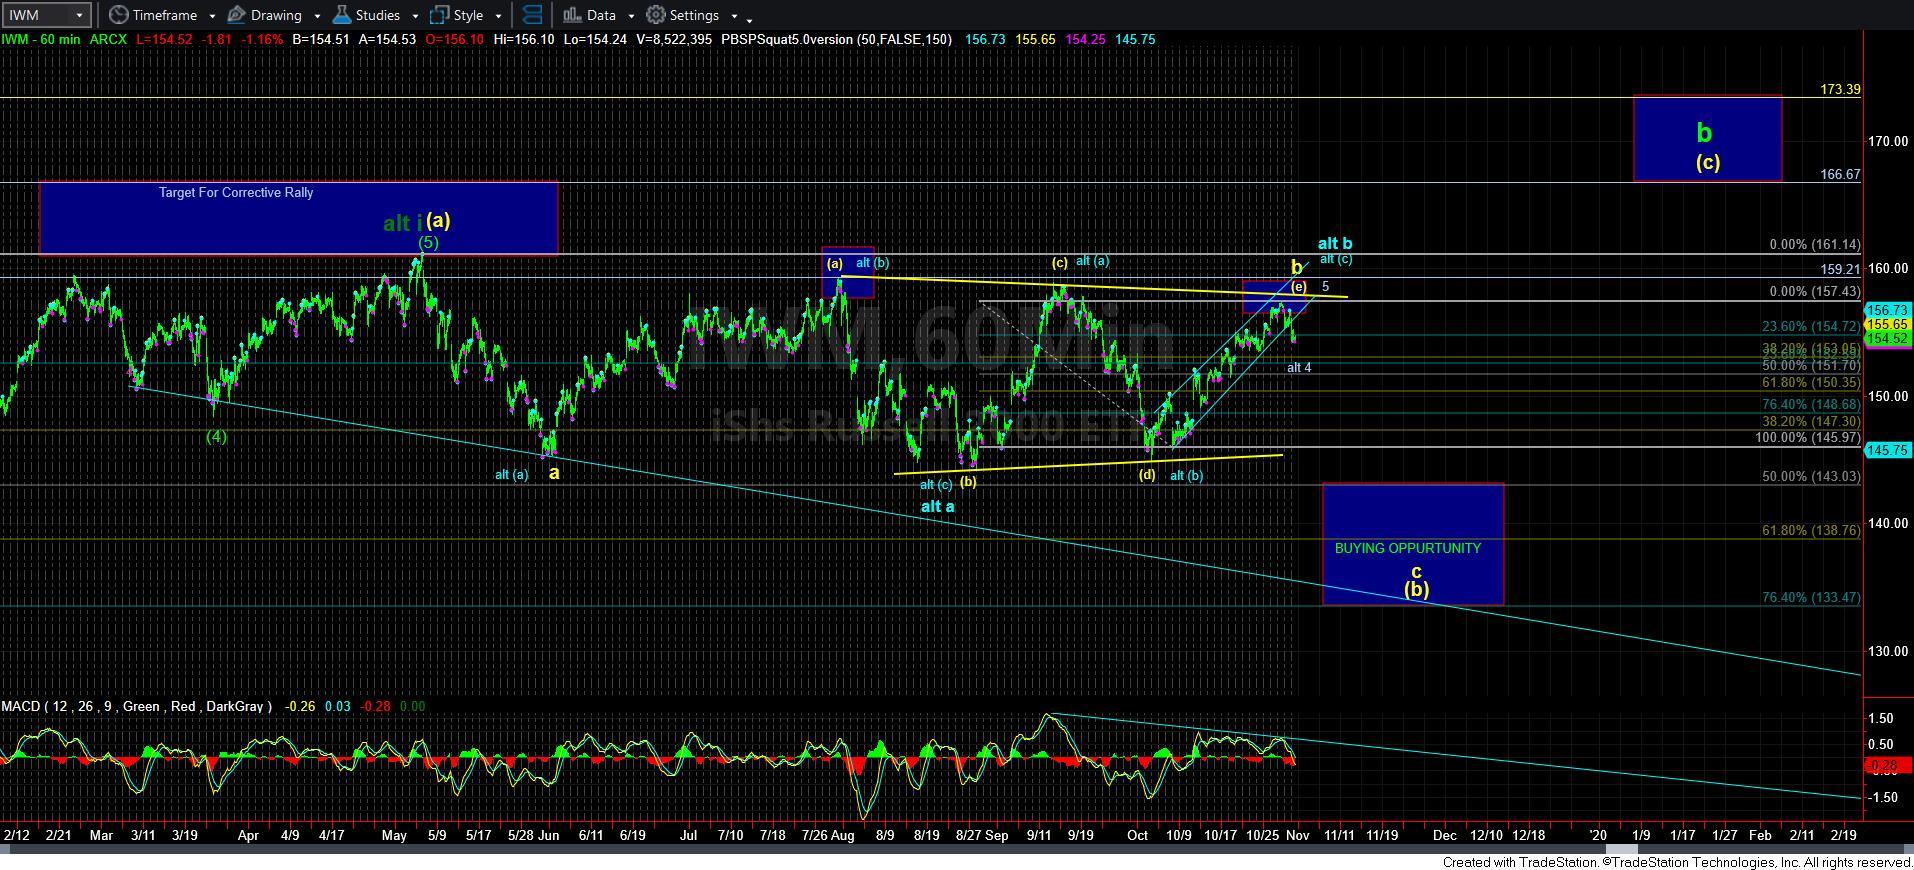
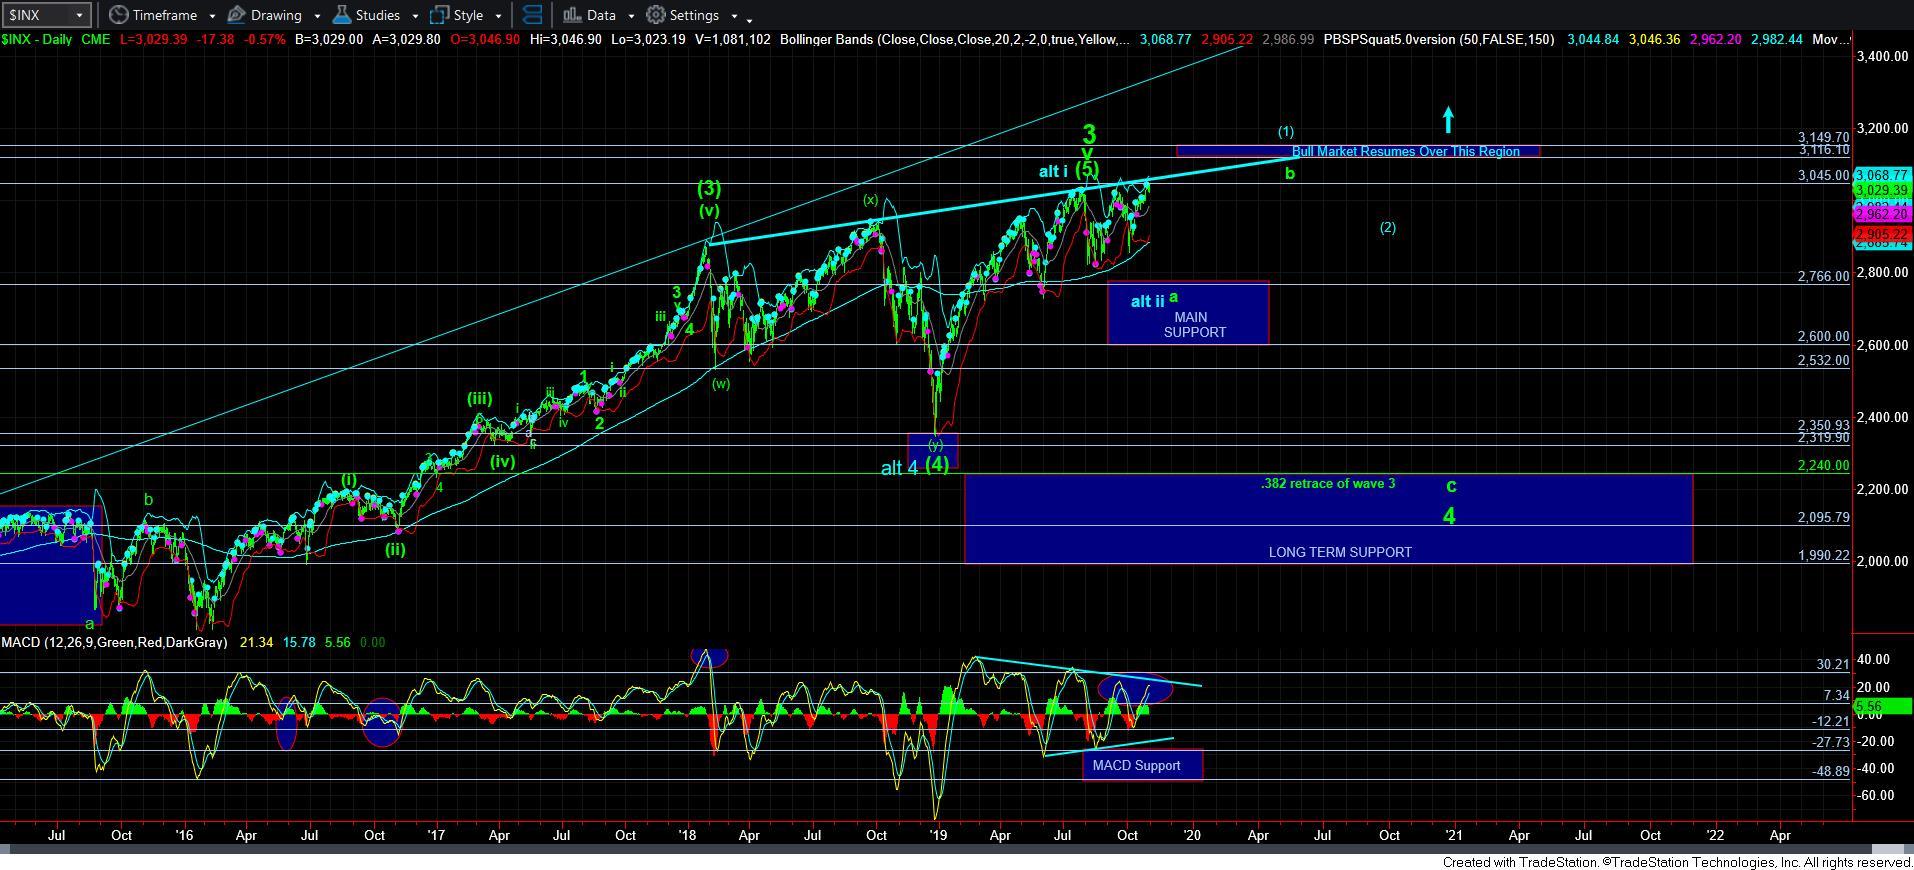
Ultimately, I see much more downside potential in this market over the coming month than I do upside potential. But, as noted on the IWM chart, please keep in mind that this next decline is likely going to be a buying opportunity for what I now expect to be a b-wave rally. And, lastly, as it stands now, my expectation is that the IWM can outperform on the downside in this next decline phase, as well as outperform on the upside on the next rally. So, prepare for much more whipsaw as we head into year end.