Bulls Are Trying To Take Control
As we came into this week, I was a cautiously optimistic bull. I reiterated that as long as the market did not break back below Friday’s low, I was going to be looking higher.
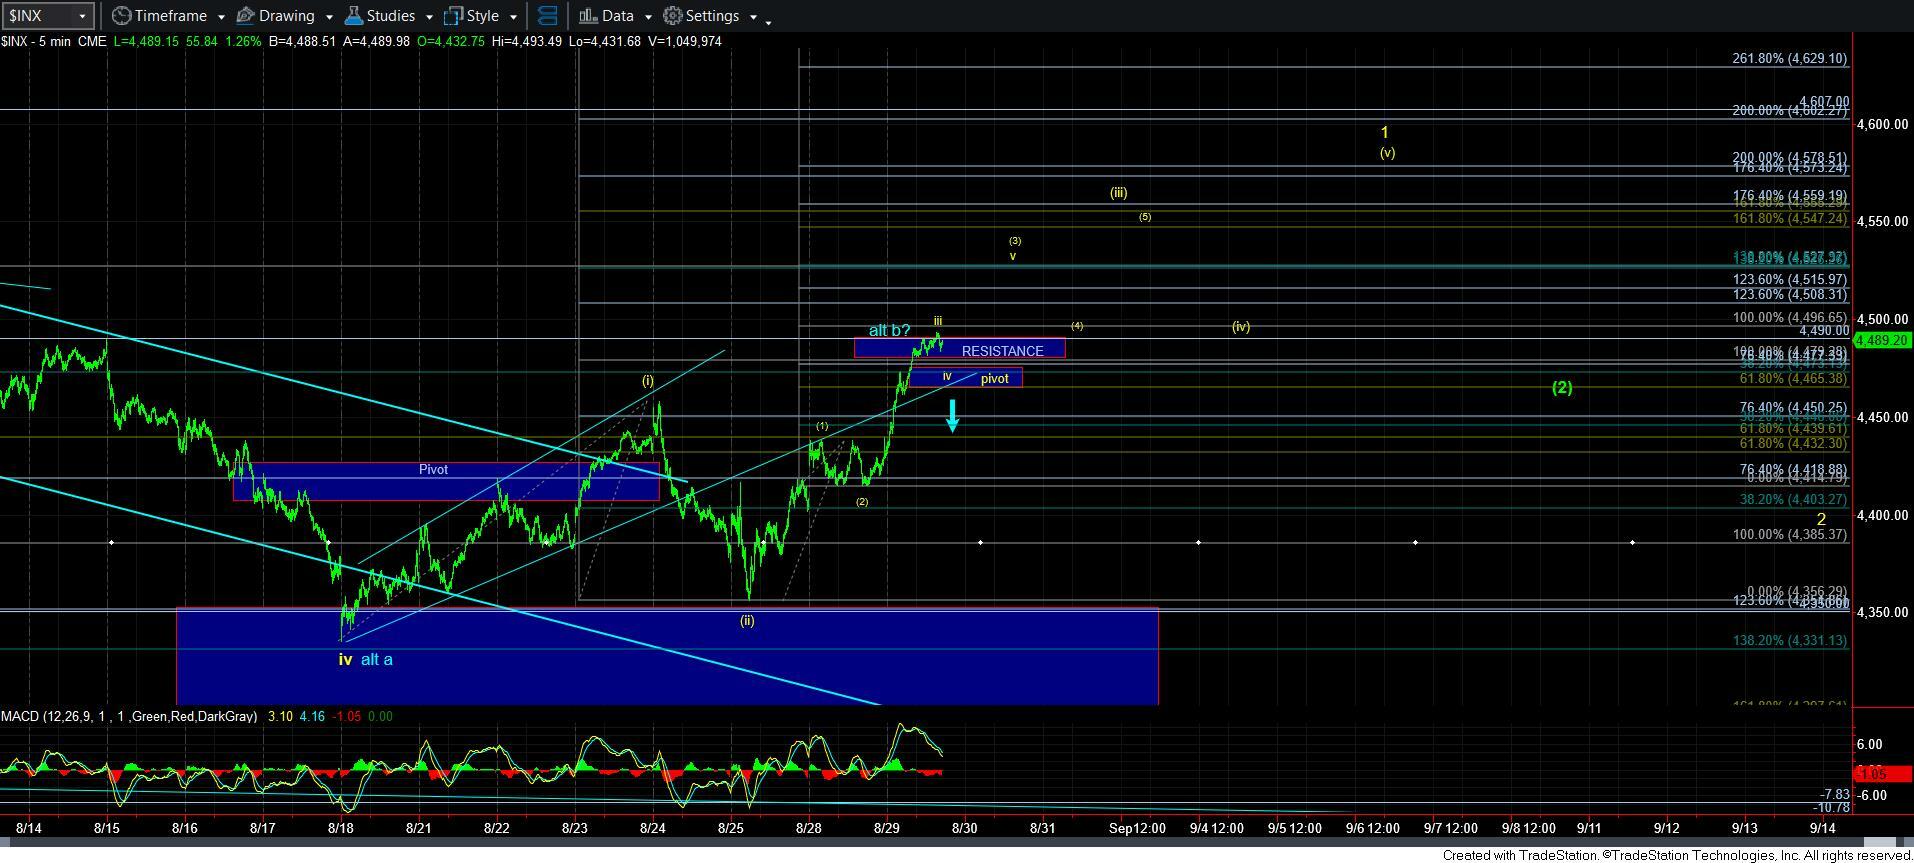
Yesterday, I was tracking the potential for a standard 5-wave standard structure in a [1][2] set up for wave [iii] in yellow. However, it would seem that the market had other ideas, in that it only gave us a non-overlapping leading diagonal for wave [1], as it certainly did not fill out a full 5-wave Fibonacci Pinball structure. Yet, because of this in the back of my mind, I warned you not to short for a pullback. This was the reason for that warning.
And, while I will not count a leading diagonal as a primary count unless I have other reasons to believe in it, sometimes they do play out. This time, the market took its opportunity to run higher without a more standard [1][2] structure. And, when we moved past the 4450SPX region, I outlined that this was now what was taking shape and we should look up next to our resistance region in the 4479-4490SPX region.
In the meantime, the market is now playing around in the resistance region we have been watching of late. As you may remember, I outlined the 4479-4490SPX region to be the point of resistance for a potential blue b-wave top. That represents the a=c resistance region for the SPX and ES respectively. The reason the ES is a bit higher is because its initial move off the August 18 low was a bit bigger than SPX. Therefore, I used both in my assessment of this resistance.
With the market moving slightly past the 4490SPX region, I am primarily viewing this now as being in yellow wave iii of [iii] of 1, as you can see on the 5-minute SPX region. This is where our Fibonacci Pinball guidance will come to help us with the path forward.
As we know, wave iii of [iii] will usually target the 1.00-1.236 extensions of waves [i][ii]. In our case, the 1.00 extension is in the 4496SPX region. Thereafter we expect the market to pullback to the .618-.764 extensions of waves [i][ii]. In our case, that provides us with support of 4465-4477SPX.
Therefore, as long as the next pullback holds the 4465-4477SPX support region (outlined as the pivot on the 5-minute SPX chart), then I am next looking higher to the 4525+ region to complete wave v of [iii] in yellow.
However, should the market break down below 4465SPX in impulsive fashion, I will likely be moving towards the blue count.
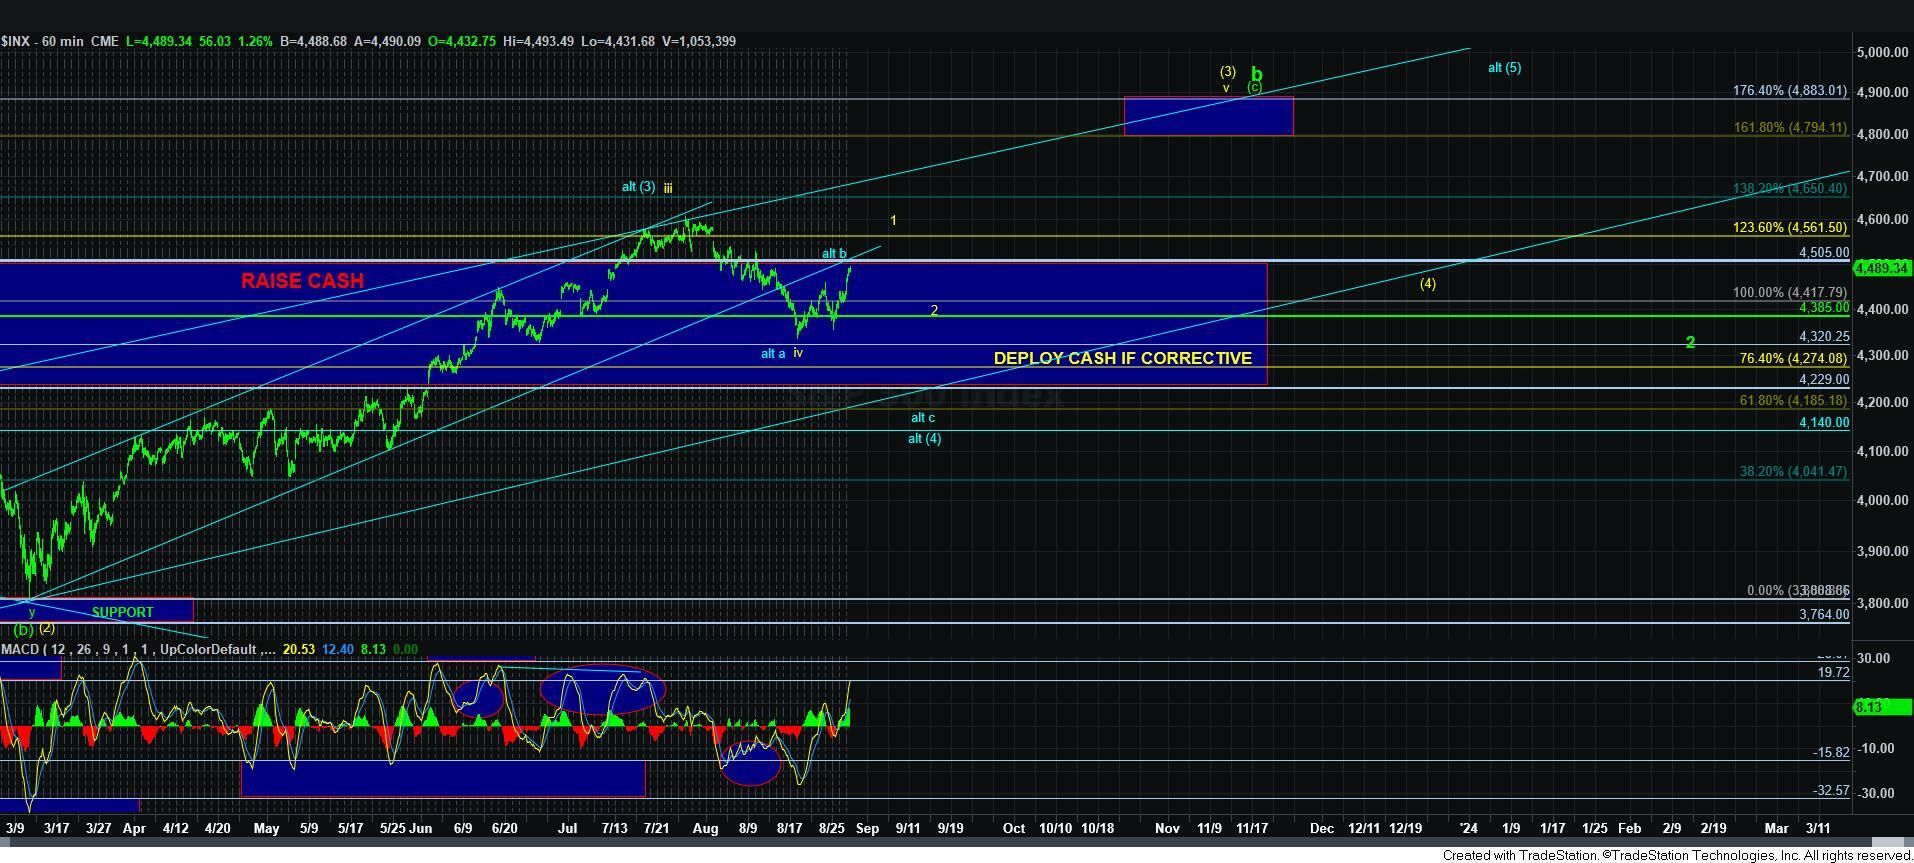
Our parameters are set quite well. And, should the market continue higher through 4496SPX, then it is much more likely that we are on our way in a more direct fashion (relative to the blue count) to 4800SPX. Yet keep in mind that we may still see a wave 2 pullback in yellow that takes us back down towards 4400SPX. Should that occur in a corrective fashion over the coming week or two, then it would be an ideal point to add long positions, with a stop at just below 4330SPX.
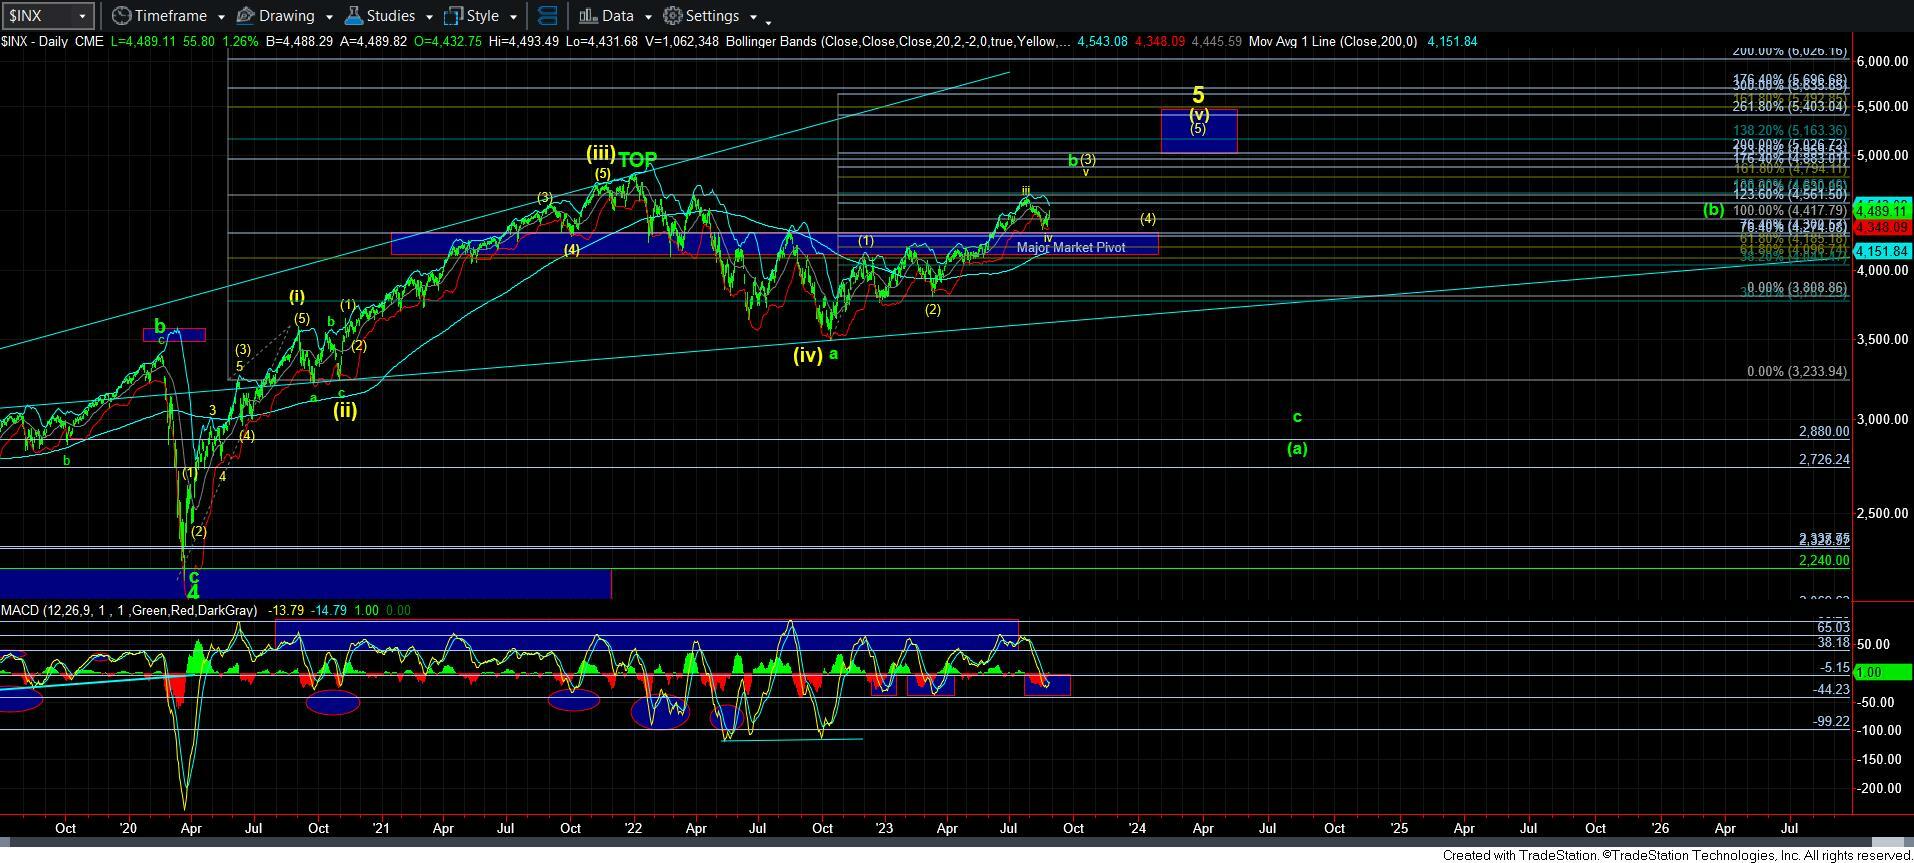
As far as the green count, I have taken it off the chart as presented before because this is too large of a rally to be a wave iv within a leading diagonal down to the 4270SPX region. Moreover, the only other bearish potential is that wave (1) completed at the August 18 low as an a-b-c structure for a larger degree leading diagonal. But, I am not going to consider that wave count unless there is further proof for such an expectation. I am viewing that decline into the August 18 low as a corrective a-b-c pullback, and will continue to do so unless there is evidence to the contrary.
Lastly, take note that the MACD on the daily chart has turned positive. If this holds for 3 days, then it is further evidence that we are likely heading up to 4800SPX in a more direct fashion.
For now, as long as we do not break 4465SPX in impulsive fashion over the next day or two, then I am looking higher to 4800SPX.