Bulls Are Trying To Begin Wave [3]
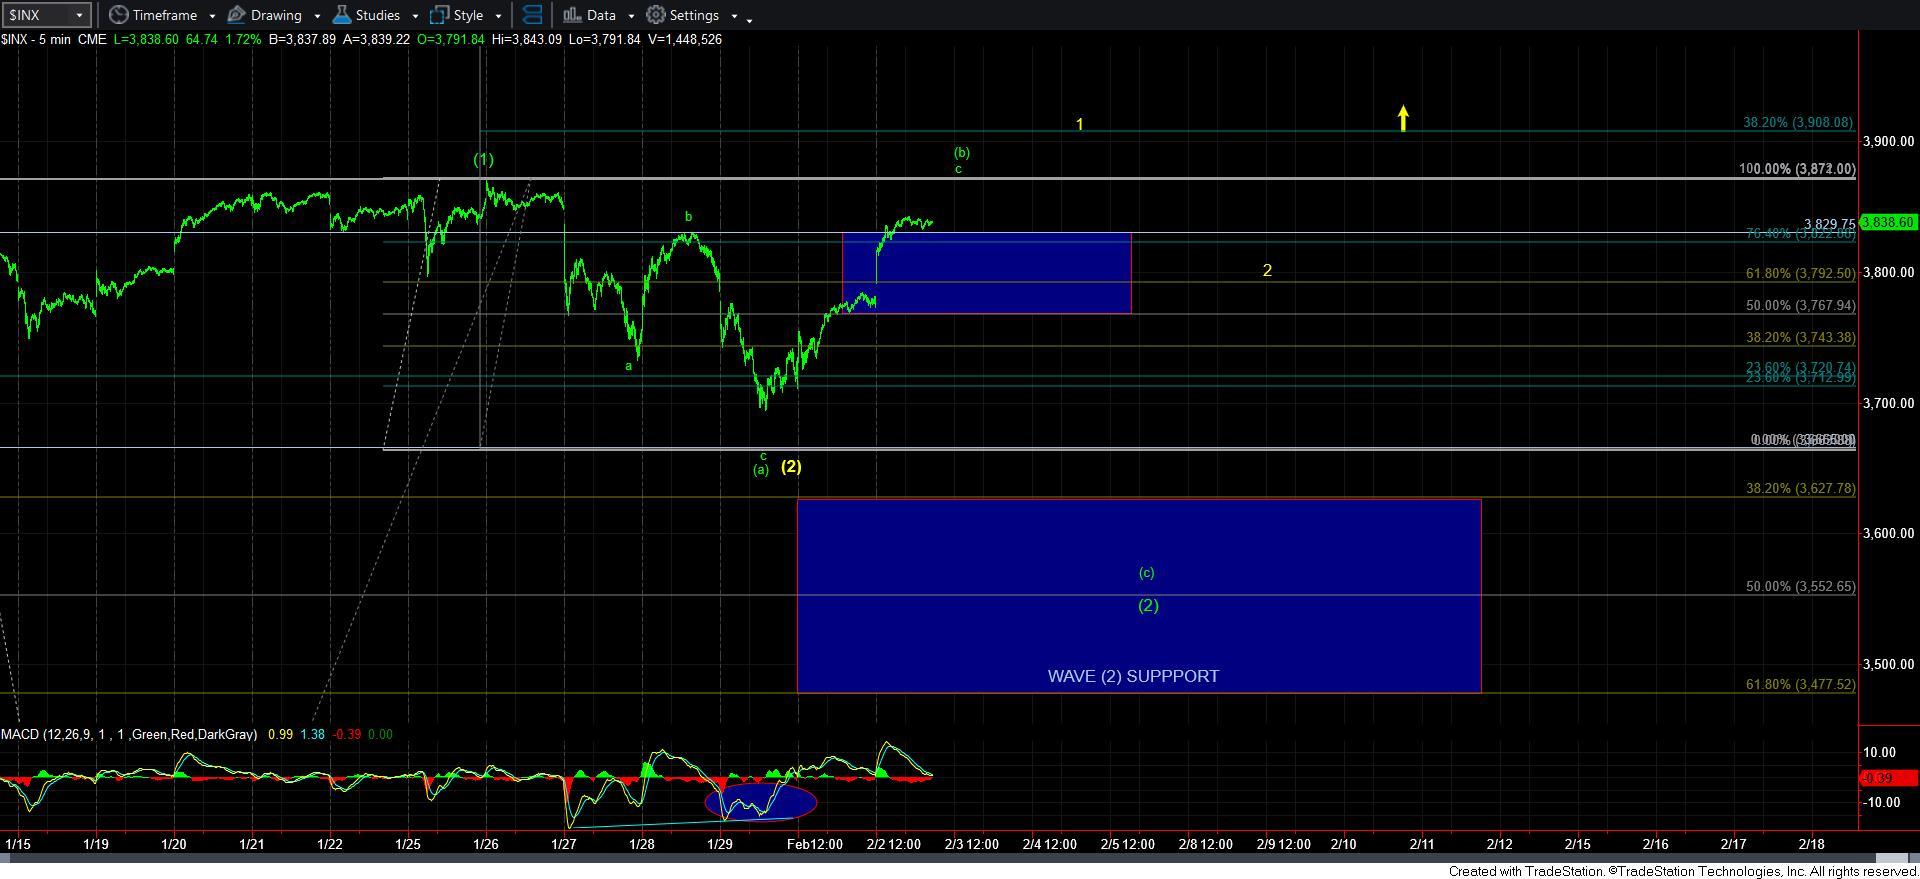
While my primary perspective has been an ongoing wave [2] pullback in the SPX, today’s move through resistance has certainly weakened that expectation.
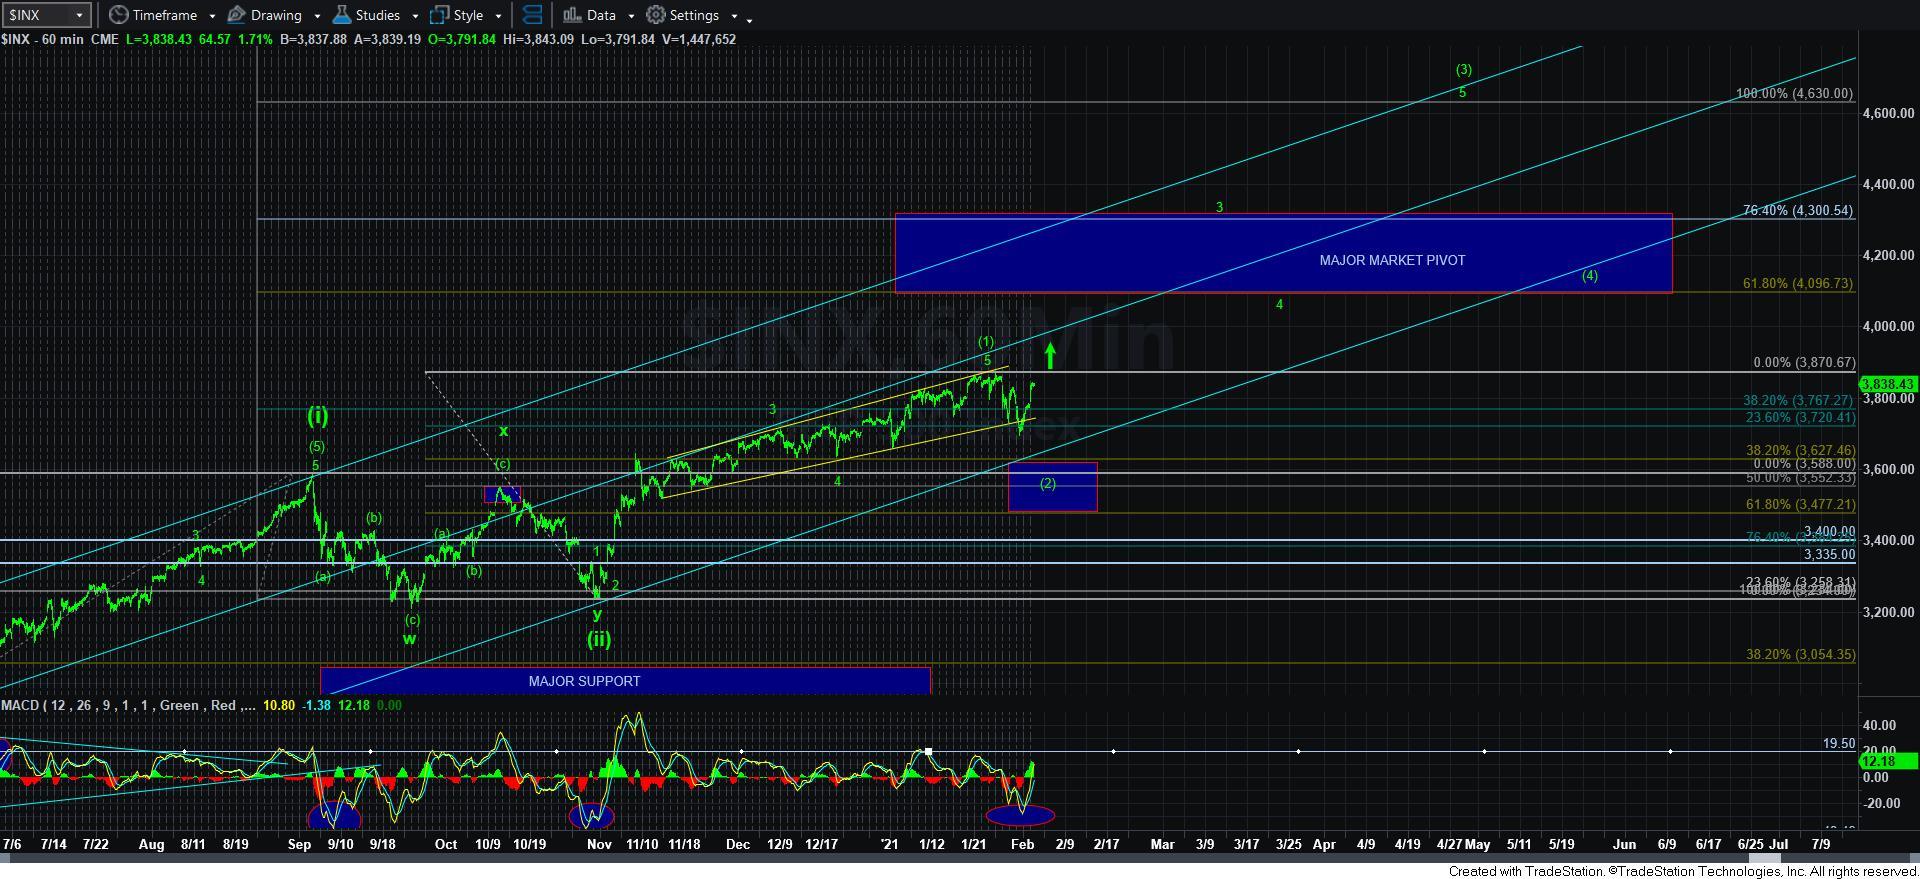
As I was warning at the end of last week, the MACD on the 60-minute charts we almost as oversold as they were during the wave [ii] pullback. This was an initial warning to me not to get too bearish. And, this week, we have certainly come off the lows struck last week. But, make no mistake about it, this indicator has now re-set to allow us to begin a 3rd wave rally.
Yet, it does not mean that the 3rd wave is underway just yet. I am going to be a bit stubborn about this, despite us being in a bull market. So, I am going to make the market prove it to me, at least before I am willing to trade the long side in an aggressive manner, as I would tend to do within the heart of a 3rd wave.
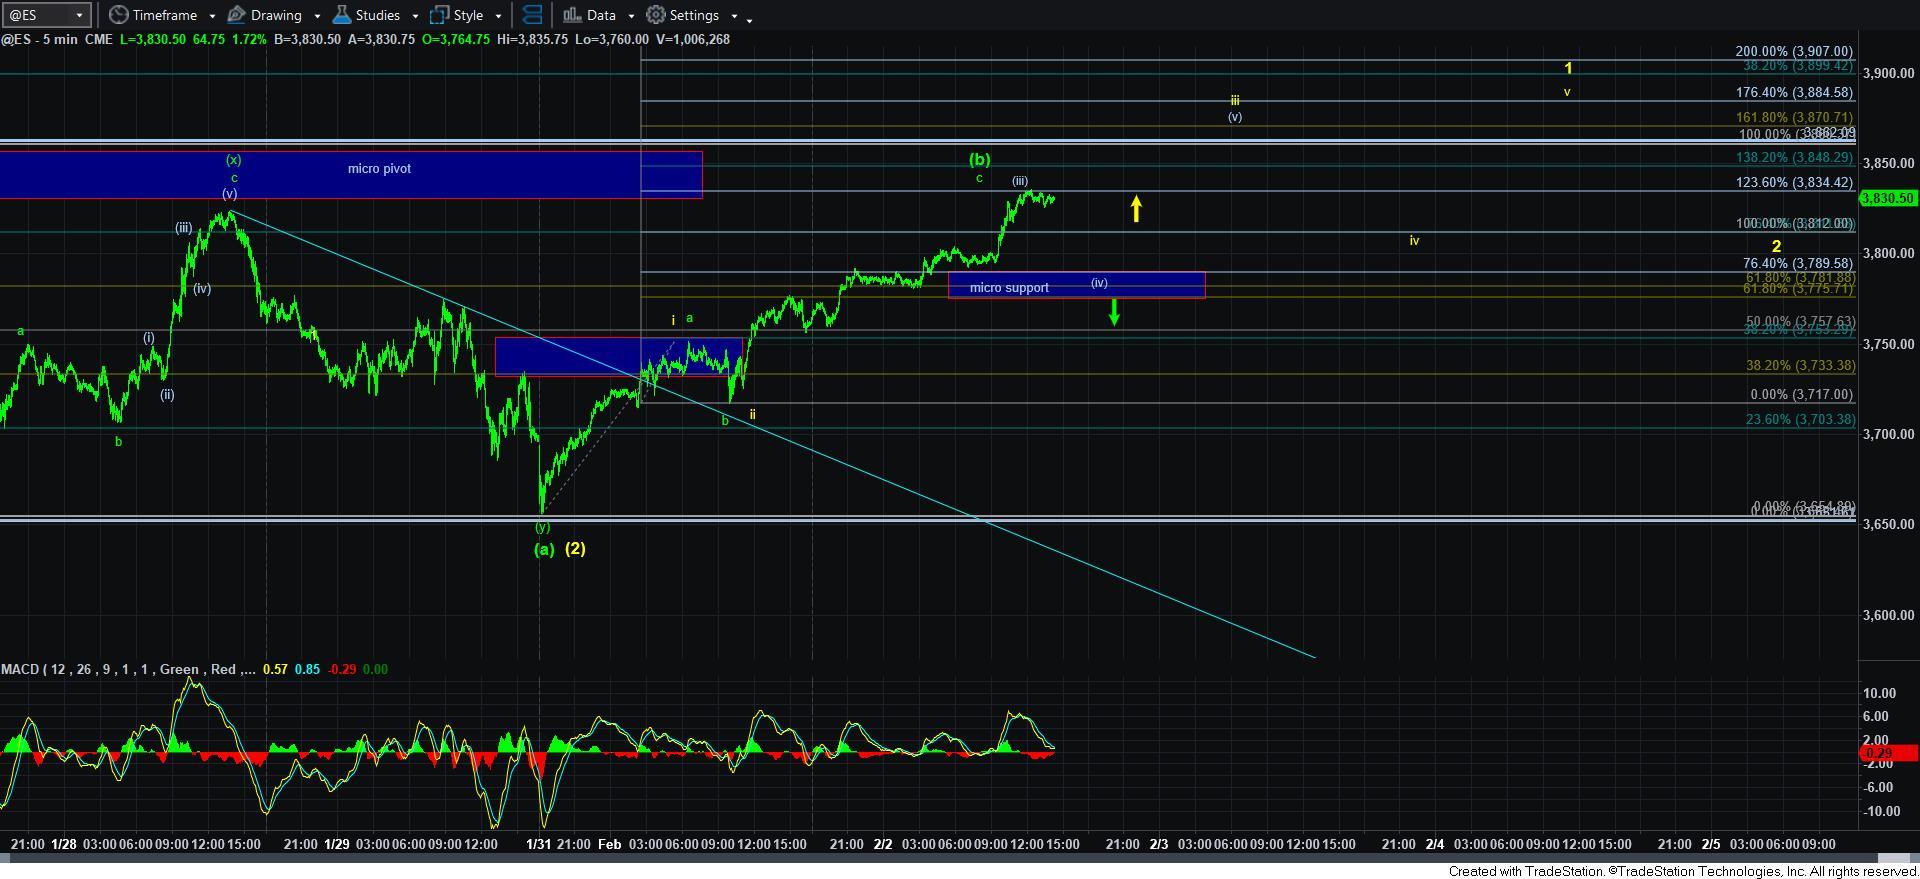
Therefore, if you look at the attached 5-minute ES chart, I am now tracking this rally as a potential impulsive structure off the Sunday night low. Based upon the current micro count, today’s high completed wave [iii] of iii within wave 1 of [3]. Oftentimes, waves [iii] of iii targets the 1.236 extension of waves i and ii, which is the high we struck thus far today. Thereafter, wave [iv] of iii normally holds the .764 extension of waves i and ii, which is the 3789ES region. And, should that hold during the pullback which is now occurring as I write this update, then we would likely be targeting the 3848-3870ES region for wave iii of 1.
But, again, I want to clearly state that the market is going to have to prove to me that we have begun wave [3]. The way it will do so is if it is able to complete all 5 waves presented in yellow on the ES chart, and then pullback in a corrective fashion for a wave 2. Thereafter, it would have to strongly break out over the high of wave 1, and that will put me STRONGLY into the wave 3 of [3] count, with wave 3 targeting the 4200+ region, and wave 5 of [3] targeting the 4600SPX region.
However, if we see the market break below the micro support noted on my ES chart this week, that would be a strong indication that we have begun a [c] wave down towards the 3600 region. And, until the market is able to complete the break out signal outlined above, I will still be stubbornly in search of more of a wave [2] pullback.
Now, some of you may view me as being too stubborn during a bull market. And, that is quite fair. But, I have an agenda.
You see, as I have been telling you to do, I have already loaded up on individual stocks in preparation for wave [3]. But, I raised some cash last week by selling stocks that were hitting their 3rd wave targets already and looking to rotate them into those that are still within 2nd wave pullbacks. Moreover, I will wait for the market to give me the signal I outlined above before I trade the 3rd wave to the upside aggressively. So, with this in mind, you can now understand why I am still going to allow the market to provide more of a pullback first. And, if it gives me the break out signal before any further pullbacks, then I will simply begin to trade the upside aggressively once I receive the signal.
So, I hope I have explained my own perspective so that you can always choose to vary from my plan. Remember, this is likely a bull market that has much higher to go, and it really is only a matter of how much more of a pullback we can see before this market starts moving strongly higher in the heart of a 3rd wave.