Bulls Are Strongly In Control Over 2410SPX Now
When the market made it quite clear that we should expect a pullback/consolidation back on March 1, which we correctly called for, we knew that our pullback would take the “shape” of a 4th wave. And, for those that understand Elliott Wave, 4th waves are the most variable of the entire Elliott 5 wave structure.
While we have standards we follow in 4th waves, sometimes the market chooses to complete its pullback outside of those standards. This may have been one of those 4th waves. Most often, 4th waves will target the .382 retracement of the prior 3rd wave, with the minority of times completing at the .236 retracement. This 4th wave seems to have completed at the .236 retracement.
Quite often, 4th waves will provide us with a relatively clear a-b-c structure, with a 5-wave c-wave identifying the bottoming potential in the market. Additionally, there is a common Fibonacci ratio relationship between the a-wave and the c-wave. This 4th wave offered none of these signs of clarity.
For these reasons, we were not able to provide a high confidence or high probability count that wave (iv) had completed in the 2330SPX region. Rather, we were looking for standard wave structure, which plays out more often than not, as we have to side with the greater probabilities, despite the fact that the lower probabilities do play out from time to time. This may have been one of those lower probability times and it is clearly not foreseeable when the market will develop a lower probability pattern.
Now, while we were still below 2410 at the end of April, we were looking for a pullback from that region down to the 2330SPX region. While the market topped at 2406, it only dropped to the 2350SPX region, missing our ideal target by 20 points. And, as I noted many times, it was quite possible this was only a wave 2 pullback.
For this reason, I continually and strongly urged – if not begged – those that follow our analysis not to short within this region, as any pullback should be used as a buying opportunity, rather than a shorting opportunity. And, in fact, I even noted on the site and in my live video that I was buying calls out to November the day we were striking the low 2350’s. Clearly, I wanted to buy more a bit lower, but my point is that I was only looking at that decline as a buying opportunity rather than an aggressive shorting opportunity. Remember, we constantly reiterated that the greater probabilities presented in this market are pointing to 2500SPX, and potentially even much higher.
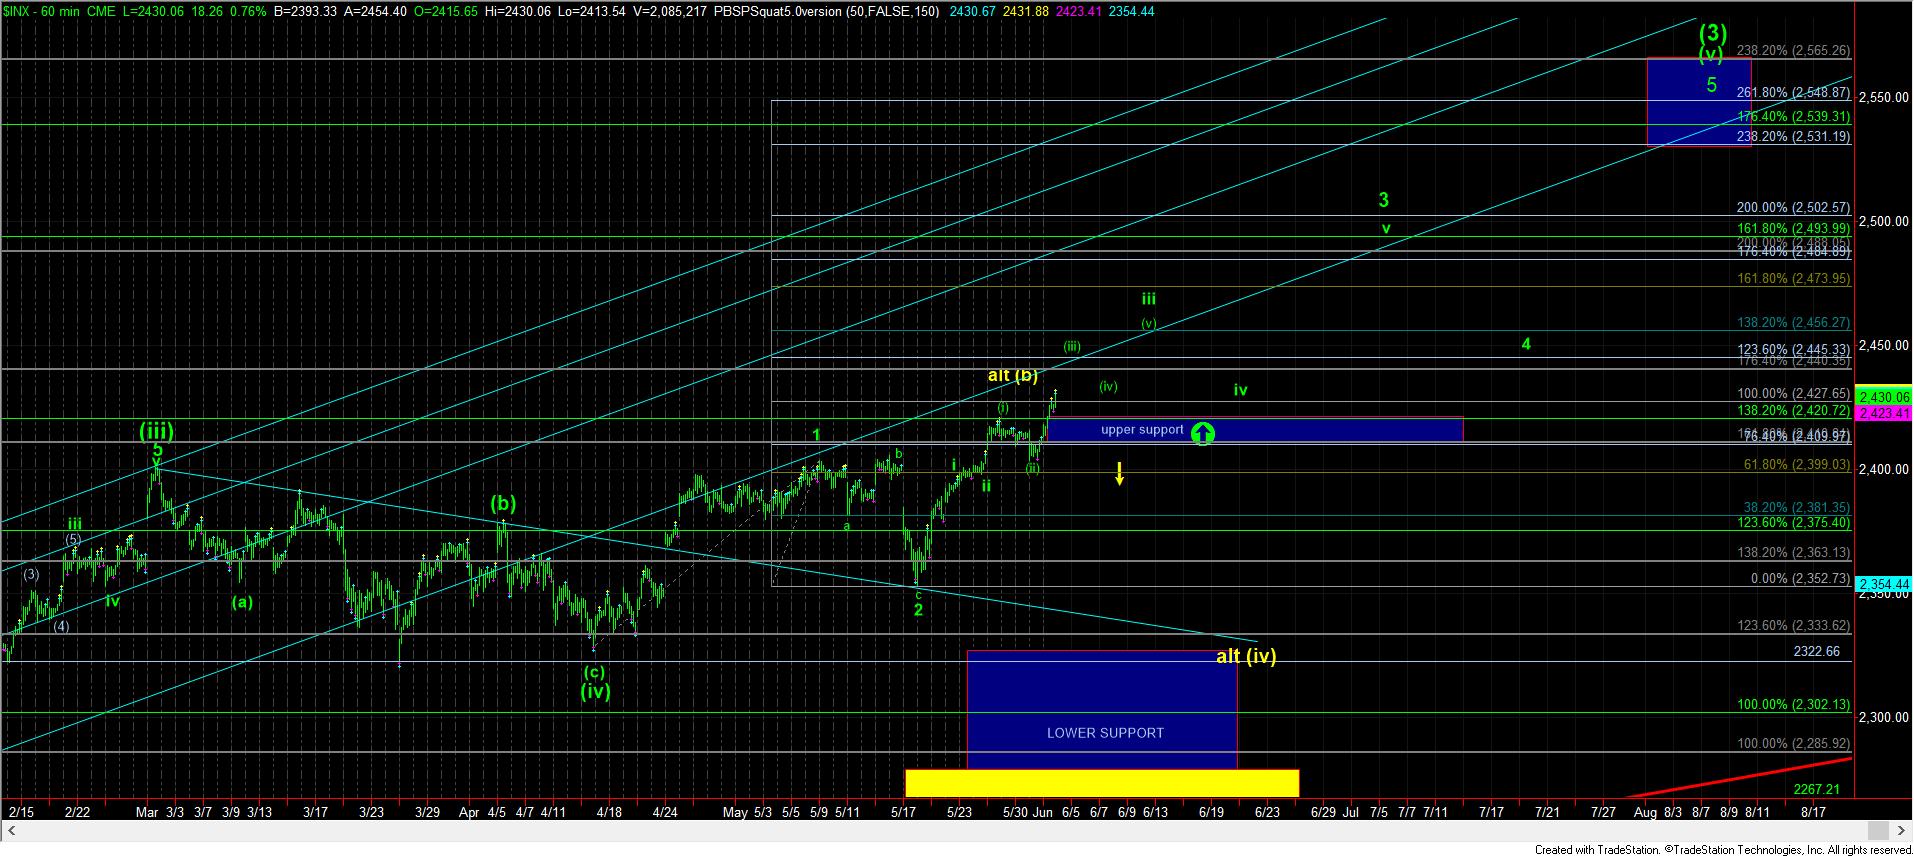
So, today, the market moved through the resistance region to which we have been pointing since the March 1 top. And, based upon the structure, I have to take a more immediate bullish bias to the market. This means that, as I noted in the title, as long as the market remains over 2410SPX, I view this as the rally to take us to 2500SPX and higher. Now, clearly, if the market completely reverses tomorrow and then takes us down to break below 2410SPX, with follow through below 2400SPX, it puts me back into the wave (iv) camp. But, this seems a bit too high right now to suggest that probabilities reside with the short term bearish potential. At least for me, the bears are going to have to prove it over the next 2-3 market sessions.
While I did not get to buy all the positions I had wanted on the long side back in the 2355SPX region, if the market can maintain over 2420SPX and complete wave iii over the next 3-5 market sessions, I will likely add to my long positions in a wave iv pullback, as noted on the 60-minute SPX chart, with a stop just below 2410SPX.
The last point I would like to address is all the “negative divergence” discussions I am seeing on the site. For those that have learned how to track indicators within a Fibonacci Pinball pattern, you will know that we are supposed to see the market beginning to provide us evidence of negative divergences in the 5th wave of a 3rd wave.
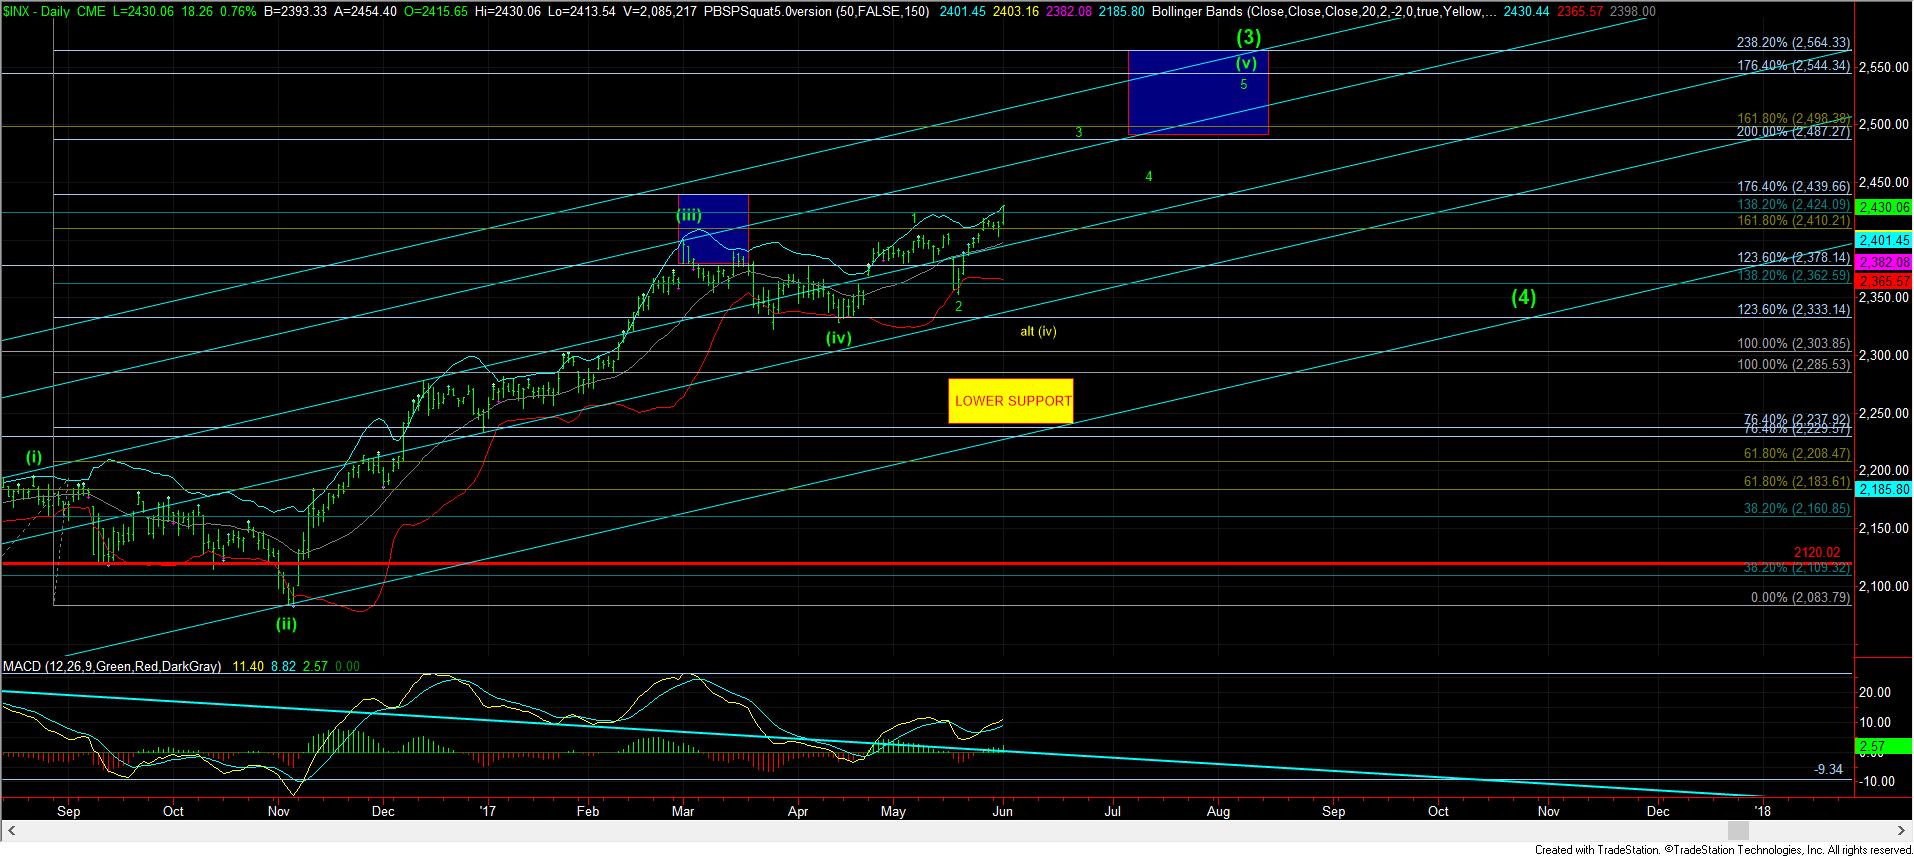
The heart of the 3rd wave is “technically” the strongest segment of a rally, which will provide us with the strongest technicals. After wave iii of 3 has completed, waves iv and v within wave 3 provide us with the first negative divergences we see within an Elliott Wave 5-wave structure. This is why so many point to the first evidence of negative divergences as a market top (like where we are right now), yet the market continues to grind higher on further divergences. And, if you look at the daily SPX chart, you will see that this rally is likely the 5th wave in wave (3) off the February 2016 lows.
Now, while you can see some divergence on the daily MACD, it seems to be in the position where that smaller degree divergence is about to break out, while the larger degree divergence will likely maintain. Of course, the bears MAY stop this rally cold in its tracks and prove a b-wave high starting tomorrow. But, I think those probabilities have been significantly reduced with today’s action.
With the MACD now pointing higher, I think we are potentially in the heart of wave iii of 3 of (v). Therefore, I will expect that, when we complete this pattern over the next few months, we will likely maintain negative divergences relative to the March 1 high on the MACD. Again, this is simply what we normally see within our Fibonacci Pinball structure. But, one has to understand the relative nature of how to view divergences in the bigger picture, rather than assuming a market is certainly topping just because you see some evidence of negative divergences. This market can still rally several hundred points higher into 2018 with these negative divergences present.
At the end of the day, one has to recognize that there is no holy grail to the market. We are dealing with non-linear structures, which, at times, do not adhere to standard, higher probability patterns, and provide us the lower probability patterns. That is simply due to the non-linear nature of human mentation as presented in the patterns in the market.
Yet, our Elliott Wave analysis provided early warning back in February of 2016 - when we were around the 1800 region in the SPX and most everyone else was looking for a crash – that we were setting up for a rally to 2500-2600SPX. Moreover, it told us to be looking to the long side of the market after Brexit and before the US election, no matter who won. Furthermore, it warned us of this pullback/consolidation on March 1 for a wave (iv) of (3). While this smaller degree pullback since March 1 did not play out in standard fashion, anyone maintaining a clear eye towards the bigger picture (and were not aggressively shorting this market) has handily outperformed most market participants even though we did not nail every squiggle in this non-standard smaller degree 4th wave structure.
For those that have been asking about my absence the last two days, I have been out for observance of a Jewish religious holiday. I posted about this at the end of last week and earlier this week in the trading room. Sorry for any inconvenience.