Bullish Reprieve - Market Analysis for Jun 3rd, 2015
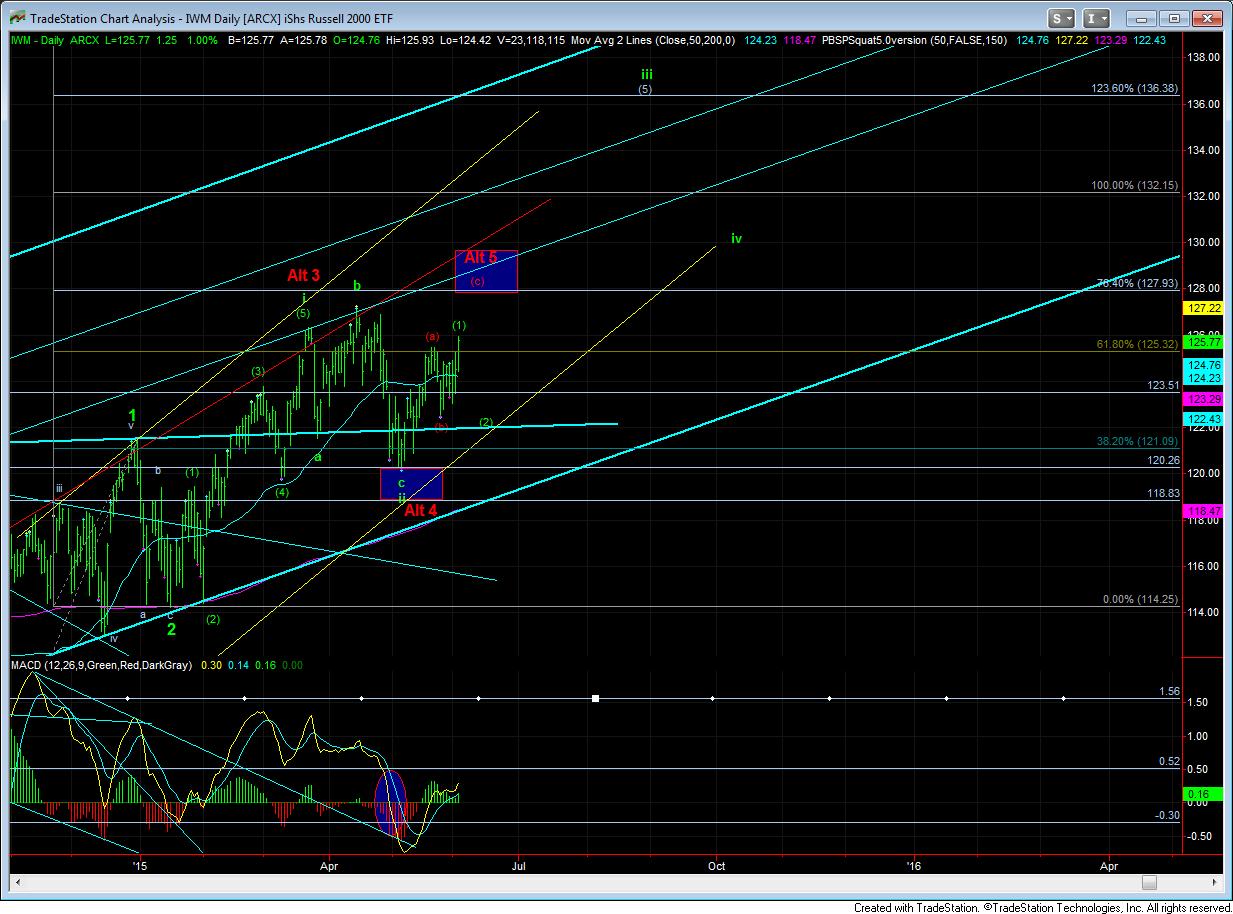
For those of you that have been following my IWM charts for these last few months, you know that I was very bullish of the IWM for 2015. However, when the last rally off the 120 region was overlapping, it aroused my deep concern for this bullish structure, and made me consider the ending diagonal in the IWM as well.
Today, the IWM has presented some form of reprieve. Today, the IWM gave us a 5th wave up, but as a leading diagonal. Yet, it resurrects the larger bullish count I have been following for 2015.
But, what can go wrong? First, if the market were to continue higher directly to the 128 region from here, it would more likely be a (c) wave of a 5th wave in an ending diagonal, and that would likely have me selling my long positions. But, note, if the market is truly in bullish mode, it will blow past that region, and then come back to test it before it continues much higher. So, I can allow the market to prove itself in that instance, and buy my positions back on the retest after it has proven its bullish intent. Otherwise, we have an ending diagonal and I do not want to hold any further.
The other thing that can go wrong is that this high is a b-wave in the red (b) wave, which bottom in the same region as the green wave (2). That would mean the next 5 wave rally is only a (c) wave in the ending diagonal. But, in this instance, we can always follow up our long positions with stops based upon Fibonacci Pinball. We would likely have some early detection that it was not going to follow through.
But, in the ideal sense, after the market completes this green wave (1) of iii, we should see a pullback towards the 122 region in a wave (2). As long as that region holds, then I will be looking for the market to blow past the 128 region in a very bullish wave (3) of iii of 3 – but will be moving my stops up as we go up since we still could be in the ending diagonal pattern. So, as I said, the market has resurrected its “potential,†but now must prove itself.
For now, any breakdown below 120 in the IWM has me donning a bear suit. But, as long as we hold support and continue higher, the IWM has been somewhat resurrected.
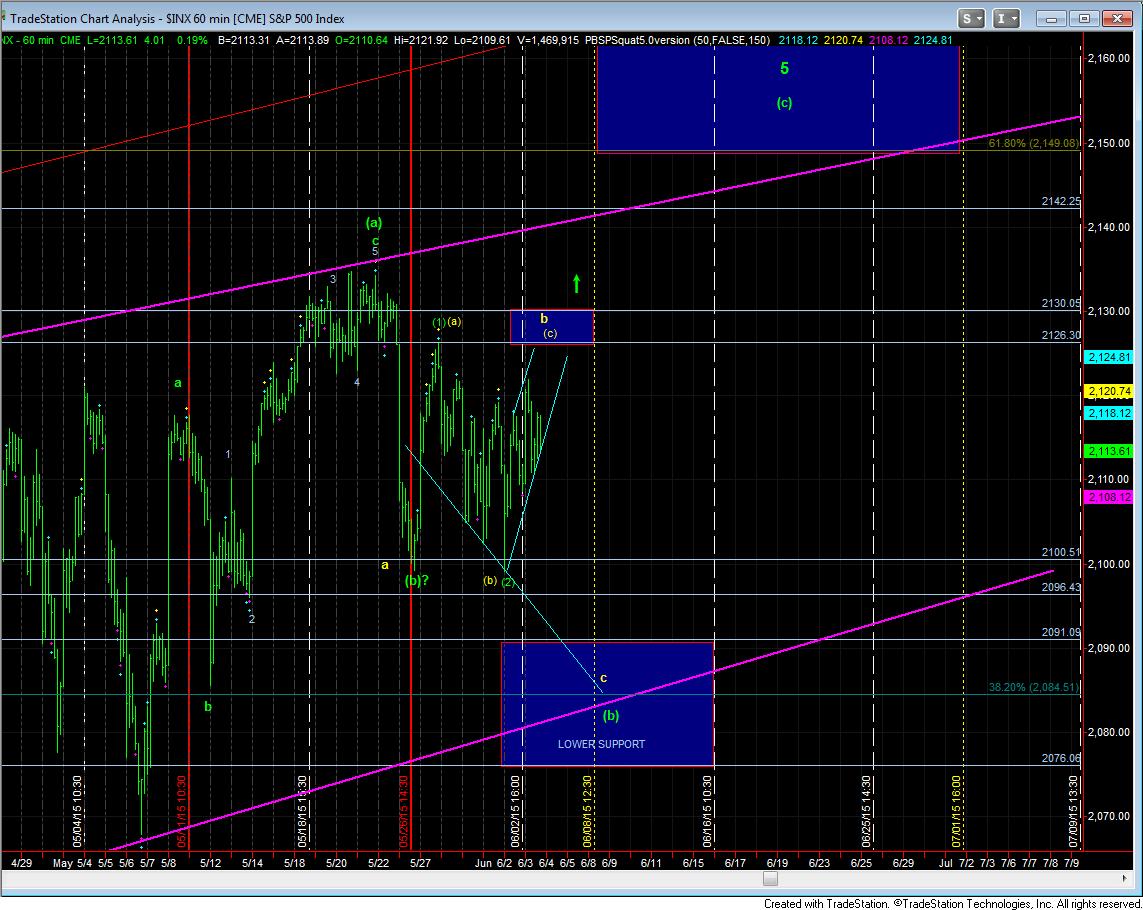
As for the SPX, as long as we remain below the 2126, then I am looking for the c-wave down to the lower support region. And, just like the IWM, If the SPX takes a direct route to the 2150 region with an immediate break out over 2130, it makes me much more concerned about the top to an ending diagonal. However, if the market plays out in the more bullish perspective on the IWM, then I am more willing to consider that this diagonal may take us much long and much higher than just the 2150-2175 region. But, my long play would likely remain in the IWM, assuming we don’t get stopped out on the ending diagonal pattern.
At least to me, the market has become much more intriguing now.