Bullish – But Still A Fly In The Ointment
Folks, I have made no secret about my bullishness as we look towards 2021 and 2022. But, my question has always been how deep of a wave [ii] will we see in the SPX before that extreme bullishness within wave [iii] takes hold.
Today’s rally has certainly added to the strength of wave [ii] having completed. It has certainly made it more likely that the next bout of weakness will only be a wave [2] within wave [iii].
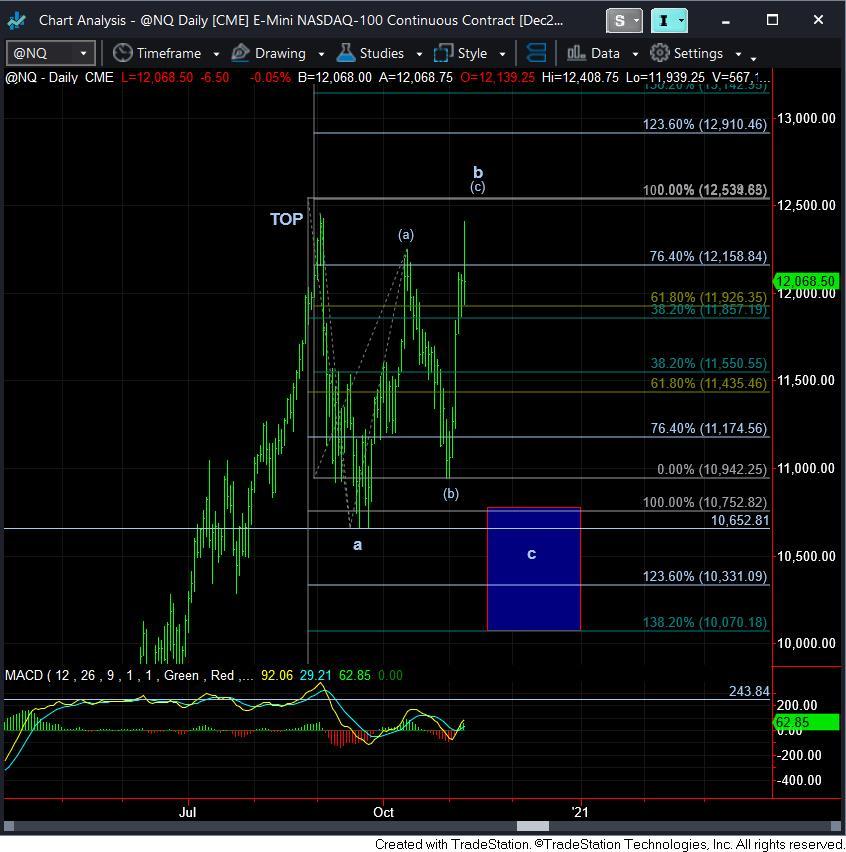
However, I still being nagged by one chart - - that is the NQ. As our members of StockWaves would know, there are quite a few high tech companies that really do not look like they completed their respective pullbacks. Moreover, the NQ itself is postured in such a manner which can surprise market participants with a strong bout of weakness in a c-wave down to complete its bigger pullback.
As you can see from the attached chart, the 12,540 level in the NQ looms large as an [a]=[c] rally resistance within a larger degree b-wave. And as long as the market remains below that resistance, I still see a reasonable probability for the NQ to see one more bout of weakness before this equity market is ready for a major take off into the heart of wave [iii].
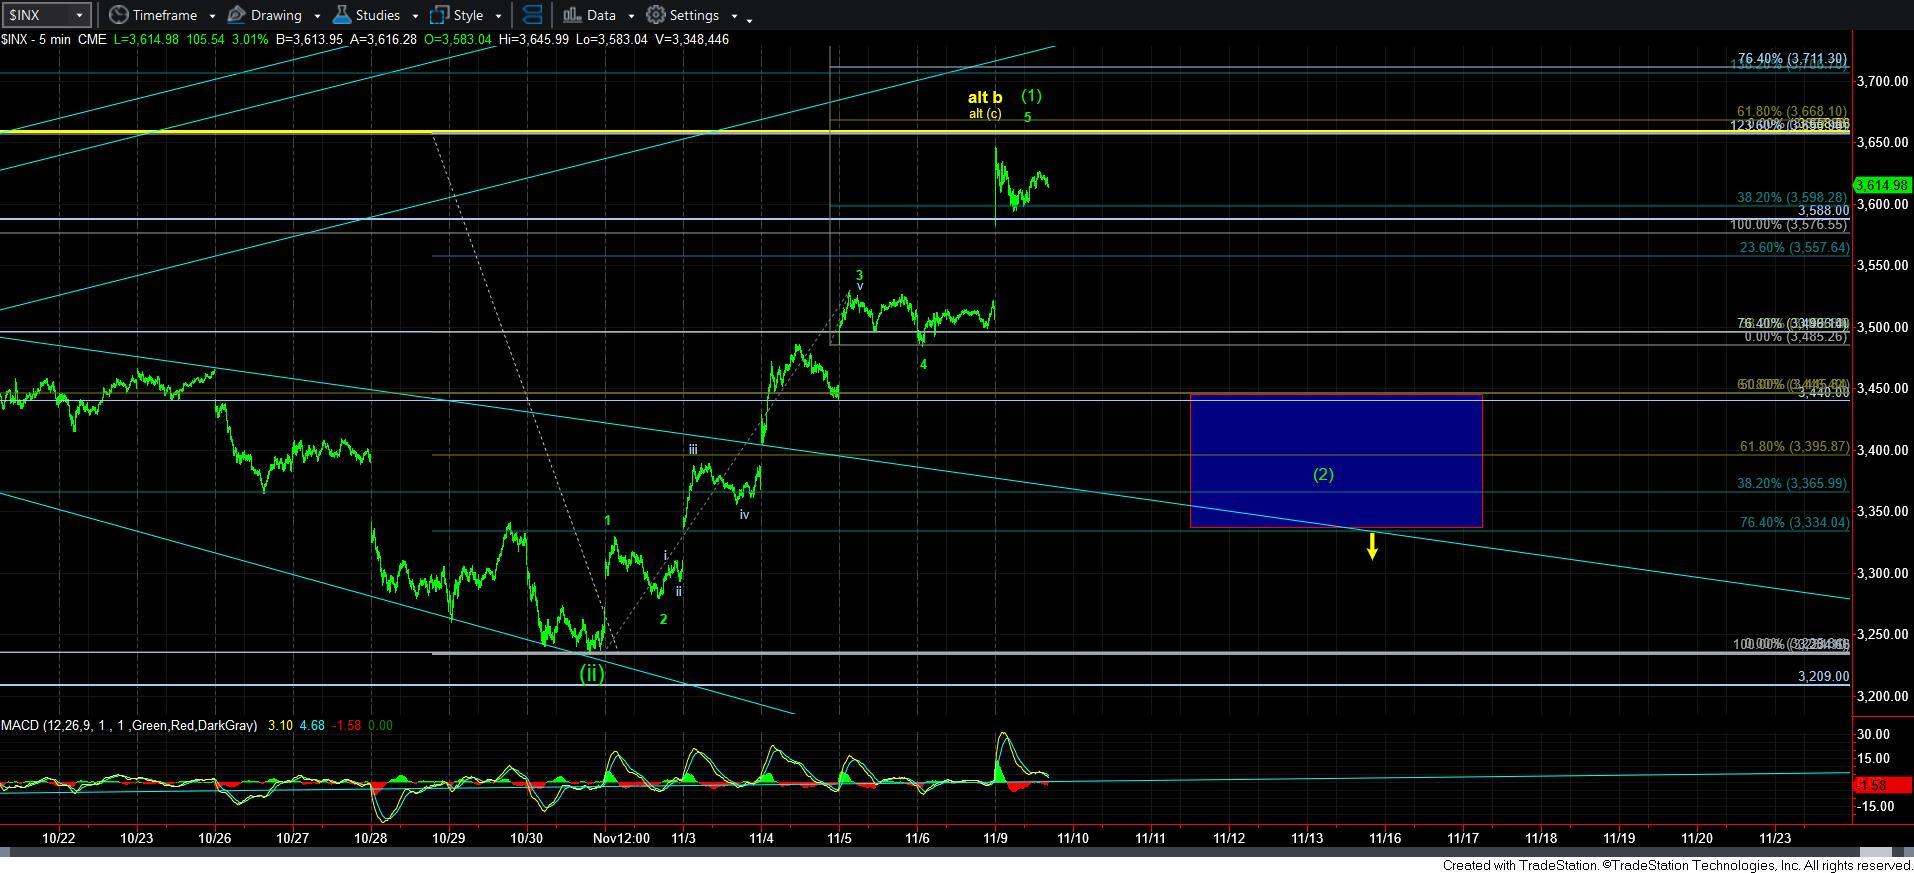
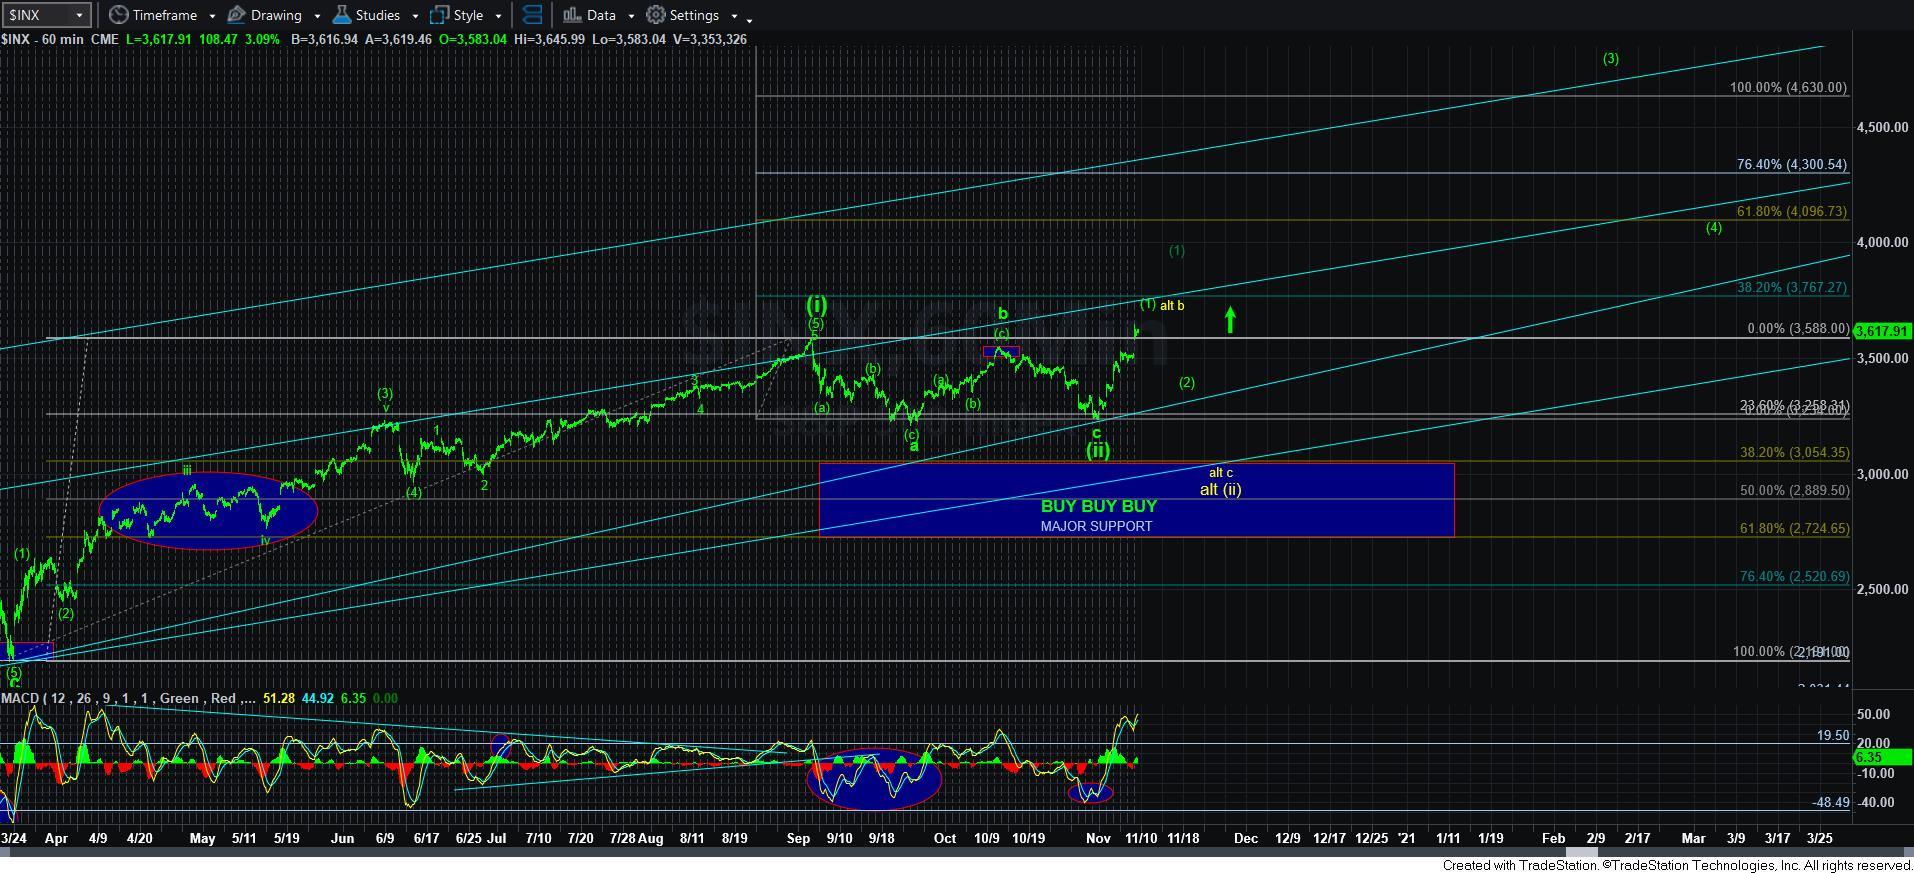
Now, while the NQ can see such weakness, it does not necessarily mean that the SPX is going to see commensurate weakness. I have now adjusted the support for wave [2] on the SPX 5-minute chart. And, as long as all pullbacks are corrective from now on, and we hold that support, I have to remain strongly within the green camp on the SPX.
Currently, the micro support in SPX is at 3589SPX. And, as long as that support holds, we have to watch the next resistance in the 3660/70SPX region. You see, if this is still wave [1] of [iii] in the SPX, then this rally – despite how extended it has become today – is still well within the parameters of a 5th wave relative to waves 1-3. Keep in mind that we often see the 5th wave push as high as .618 times the size of waves 1-3 from the bottom of wave 4. That being the case, that is how we have the 3660/70SPX resistance calculated on this chart.
Ultimately, I still think one more bout of weakness can be seen in the equity market for as long as the NQ remains below its b-wave resistance potential of 12,540. Should it break out of that resistance before we see a c-wave decline, then there is no doubt in my mind that wave [iii] is upon us in the equity market and will likely take us well into 2021. But, as long as we remain below that resistance, I still can reasonably see another bout of weakness in the coming weeks, which is just yet another buying opportunity before wave [iii] takes hold in earnest.
So, while the SPX has only provided us with a VERY shallow .236 retracement for its wave [ii], I have to view the next bout of weakness as wave [2] in wave [iii], unless the market CLEARLY provides us with an impulsive decline which breaks support on the 5-minute chart, and points us back down to the ideal target in the 3050SPX region. For now, I see that as my alternative count, and the market will now have to PROVE that potential to me as outlined over the weekend.