Bull/Bear Lines Have Now Been Drawn
While we came into this week with the expectation for a bounce in the market, we may be seeing a bit more than just a simple bounce.
You see, while the move off the lows on Friday was very overlapping, it actually counts quite well as a leading diagonal. And, despite my aversion to leading diagonals as trading cues, this is actually one of the better ones I have seen from a structure standpoint.
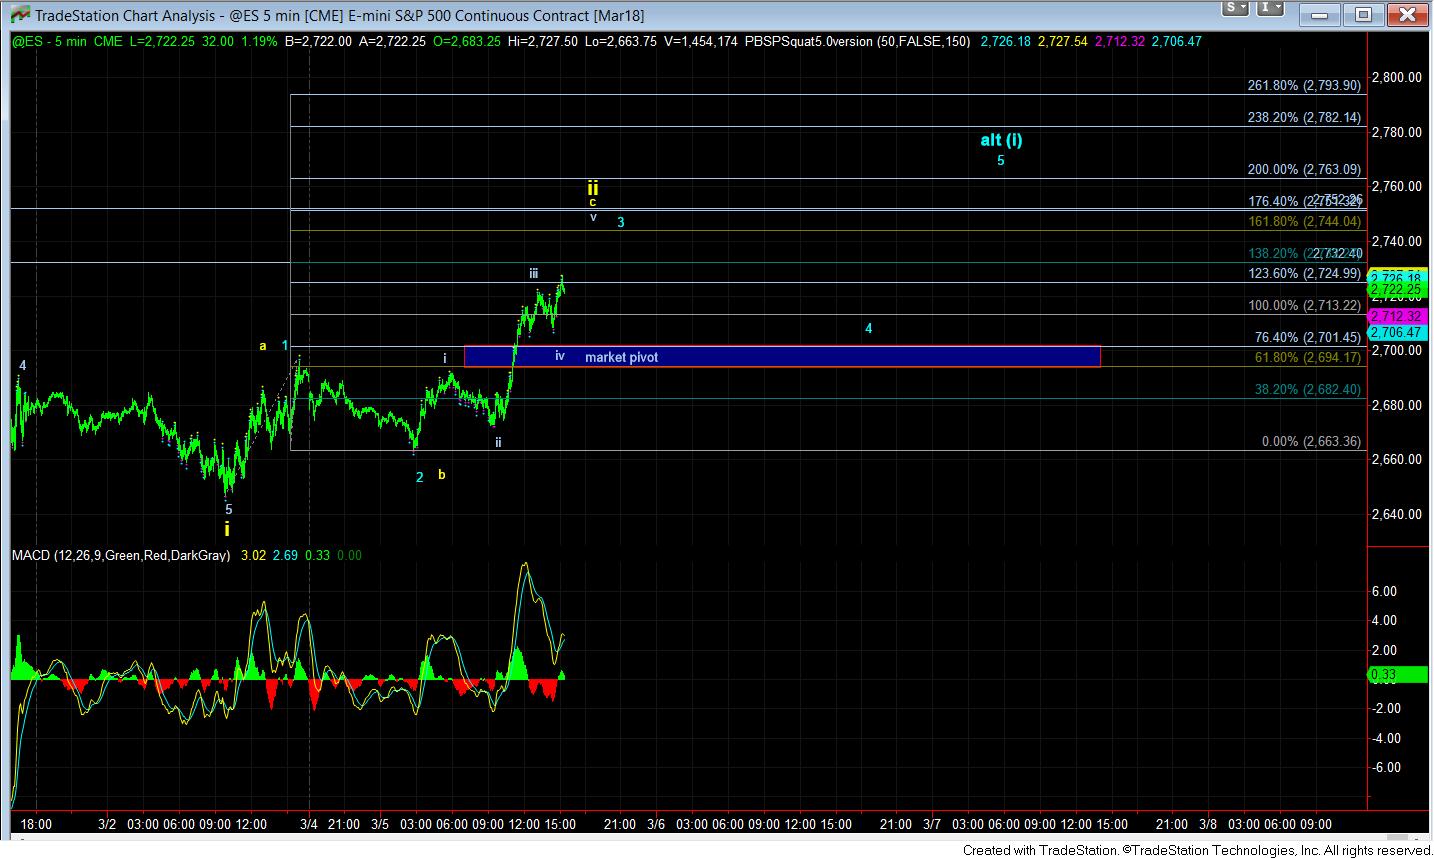
What this means is that the market MAY be attempting to complete 5 waves up off Friday’s low. As you can see on the attached 5-minute ES chart, if the market can complete 5 waves up this week up towards the 2763ES region, it would force me to consider the fact that wave (4) has completed in a much more serious way. But, we are not there yet, so I just want to show you what may turn me a bit more bullish BEFORE it happens, so that there are no surprises in my analysis should we see this 5 waves complete.
My primary count is still that we are only completing a corrective bounce in the yellow wave ii. However, as noted above, we will need to break down below the market pivot on the 5-minute ES chart, which means we will need to see an impulsive 5-wave structure drop us below the 2694ES region to open the door to the next larger drop towards 2600SPX and potentially much lower.
As you can now see, the bulls and bears have drawn their lines for this week, and how they react in the coming day or two will likely take us whether we may have to reconsider bigger downside follow through before we begin our rally to 3000+. So, rather than simply guess at what the market wants to do in this region, I think we will let the market tell us based upon how it handles its next pullback. For now, I still expect downside resolution, unless, of course, the market provides us with that 5 waves up towards 2763ES this week.