Breakout Or Fakeout?
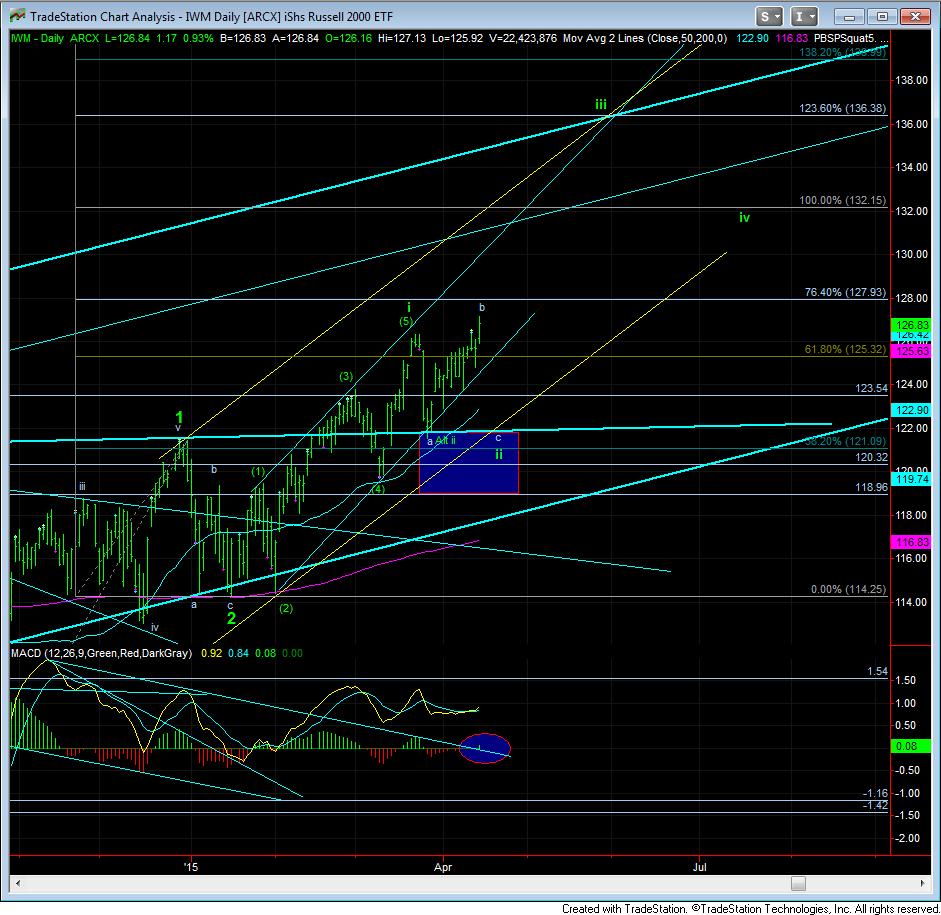
With the higher high we made today, it can put a more IMMEDIATE bullish spin on the market pattern, which was already quite bullish. As we see in the IWM, we are approaching the break out level at 128, which, if strongly overcome, points us directly to 132.
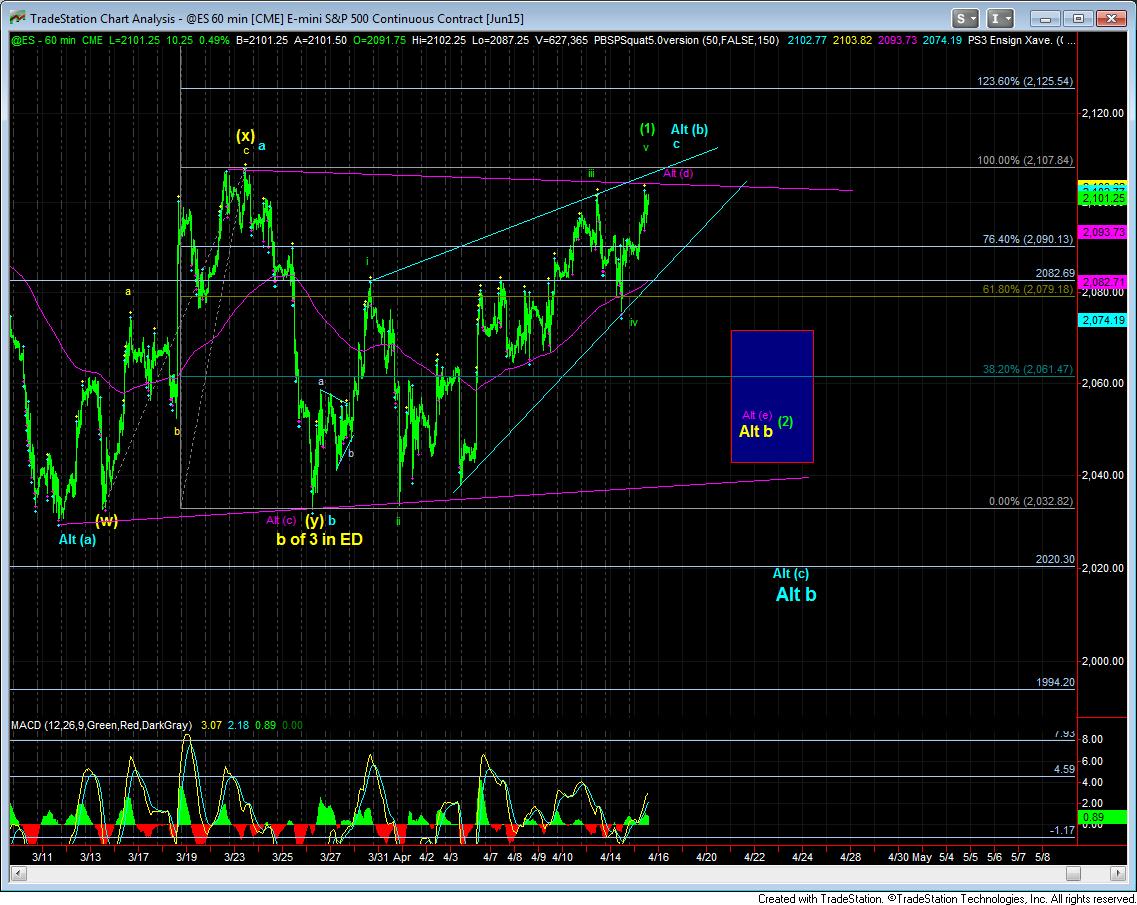
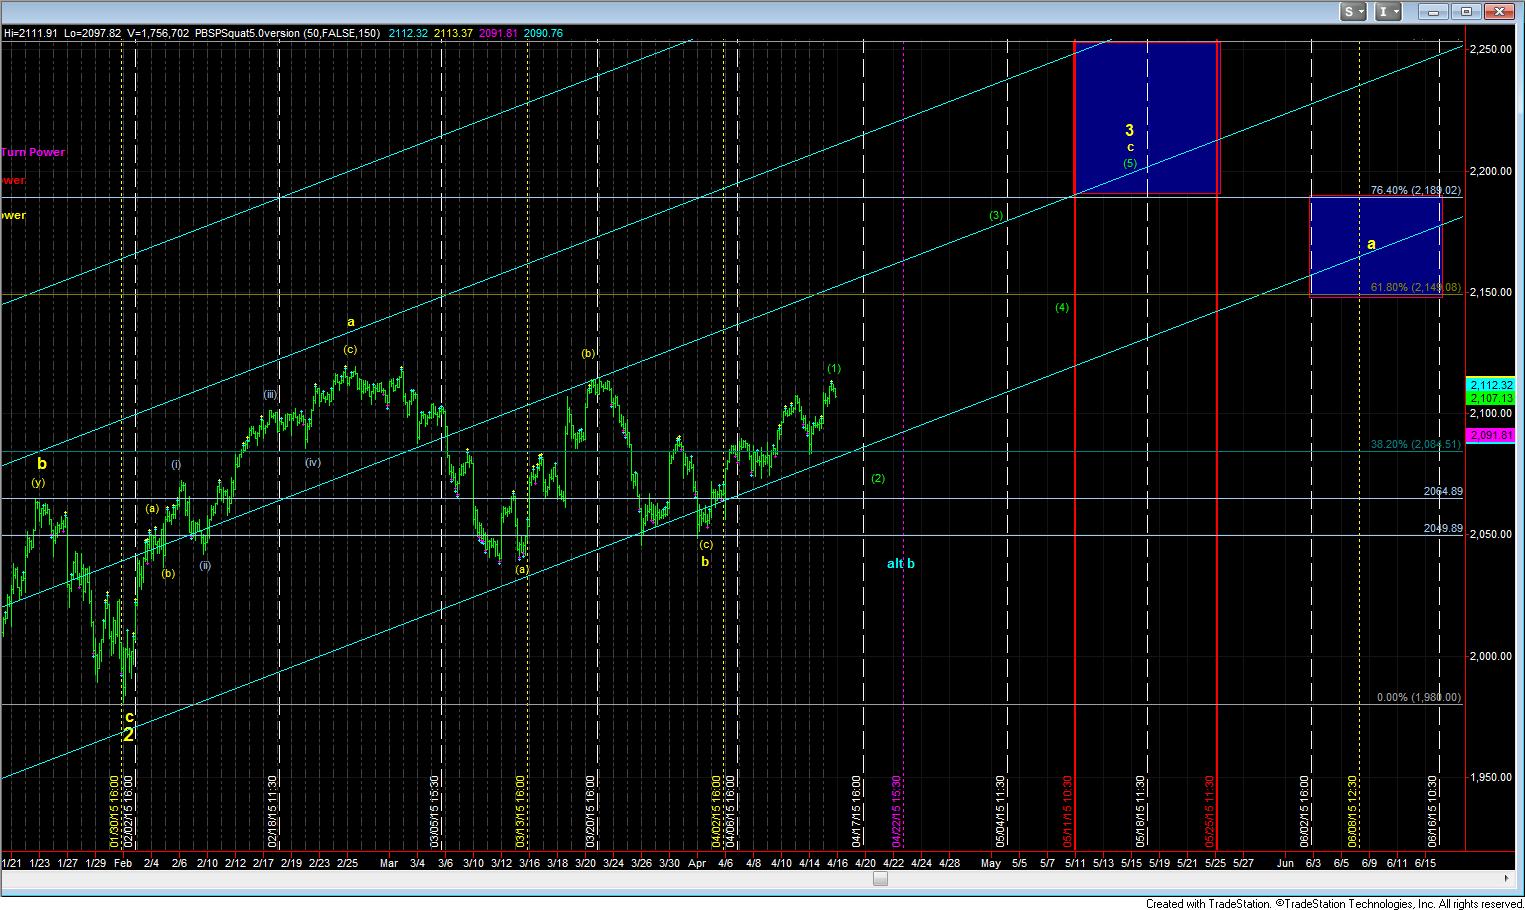
However, I cannot say that the pullback we needed or wanted to see is not going to happen. While the triangle count is still quite possible, I have taken it off the chart only for aesthetic purposes for now, since the (1)(2) pattern has the same effect, and we can revisit the triangle later should we bottom in the blue box, which I did move up to accommodate a wave (2). The reason I did so was not because I think the probabilities are greater for the wave (2) as compared to the c-wave lower, but simply because I am giving the bull market the benefit of the doubt. I still believe that a c-wave would look best in this count, but I refuse to fight this market, which is developing rather bullishly in the larger scale.
I will note that should we begin a CLEARLY impulsive 5 wave structure off the highs in both the IWM and the ES, then I will be moving heavily back into the c-wave lower. Until such time, I am actually 50/50 as to which one will play out.