Break Out - Market Analysis for Mar 11th, 2021
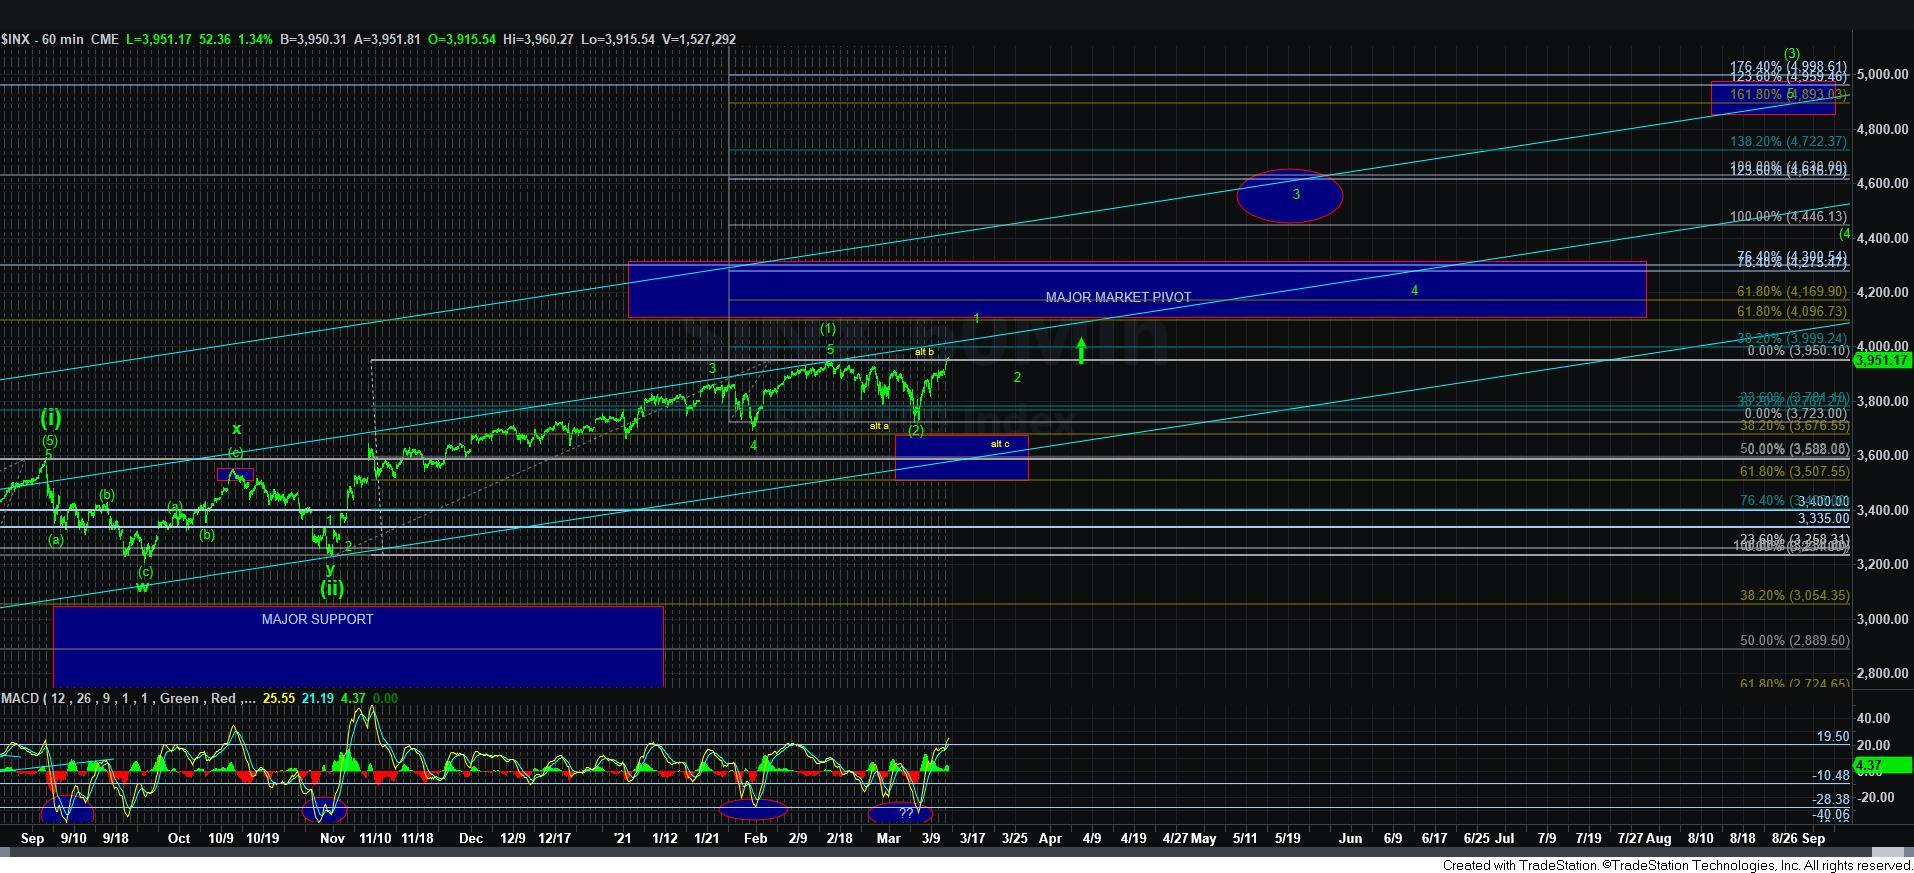
So, as the markets have taken us to higher highs, we are well on our way to setting up the rally to the 4300+ region in the coming months.
While I have been questioning whether wave [2] has actually completed, the break out of the resistance we have been focused upon these last few days has made it much more likely that wave [2] is done, and that we are rallying to complete wave 1 of [3]. So, let’s discuss what we are seeing.
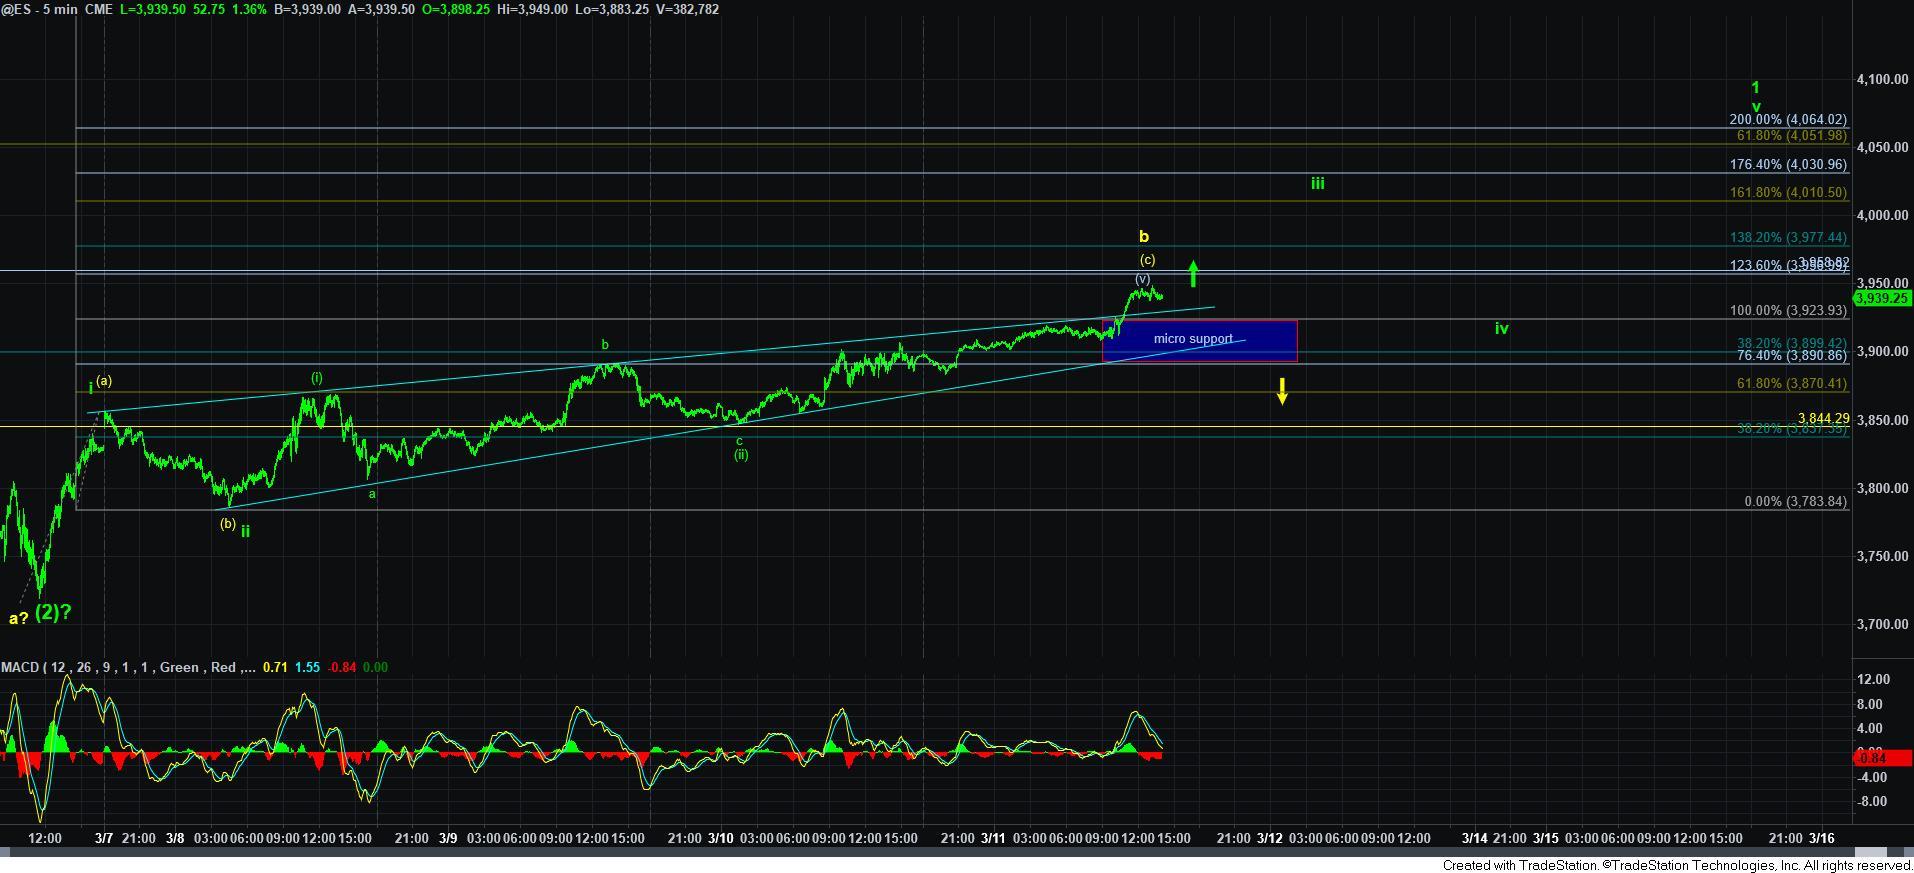
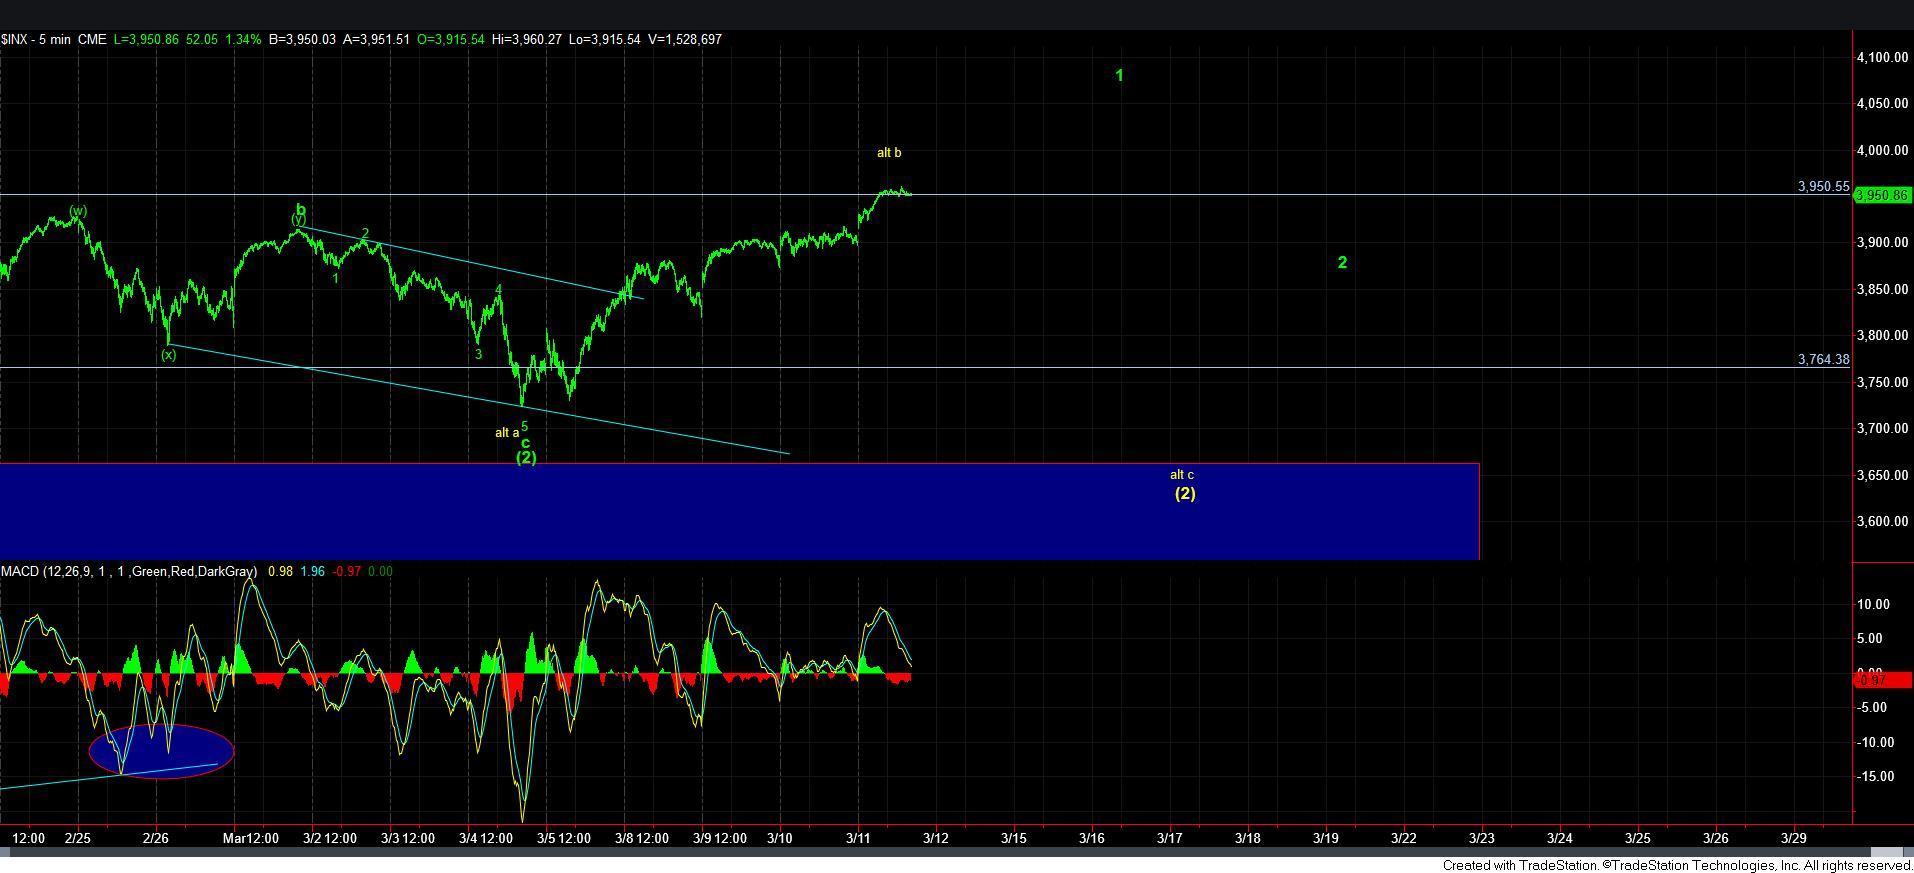
First, please recognize that I am leaving the yellow count on my SPX charts, as I always need an alternative. And, the most reasonable alternative is that this rally is a b-wave in an a-b-c wave [2] structure. With the break out through the 3924ES level – which is the [a]=[c] level off the recent lows in the June contract (which Tradestation has now moved me on to), it makes the potential that this is a b-wave lower in probability. So, at this point in time, I am viewing us as heading up towards the 4050-4100SPX region. It would now take a strong and impulsive break down below 3890ES in the June contract to make me consider otherwise.
That leaves us with the bullish green count. And, I am going to be brutally honest in noting that I do not have a clear and clean way to count it at this time. But, I have made an attempt to show the potential on the 5-minute ES chart in green. But, I am simply going to be abiding by the 3890ES support level, and allow the market to continue higher towards the 4050-4100SPX region to complete wave 1 of [3].
Assuming the market does continue to grind higher in the coming week or so to complete wave 1, then I would expect wave 2 to bring us back down into this region to re-test this break out point, and maybe even take us a bit lower towards 3900SPX before we are ready to begin our assault on our next higher targets.
This brings me to my next point about our targets. If wave [2] is indeed in place, this most likely means that wave 3 of [3] is targeting at least the 4400SPX region, which is the 1.00 extension of waves [1] and [2], with potential to rally as high as the 4600SPX region, which is the 1.236 extension of waves [1] and [2]. And, if this is the correct wave structure, then this should happen rather quickly, and likely within the next two months or so.
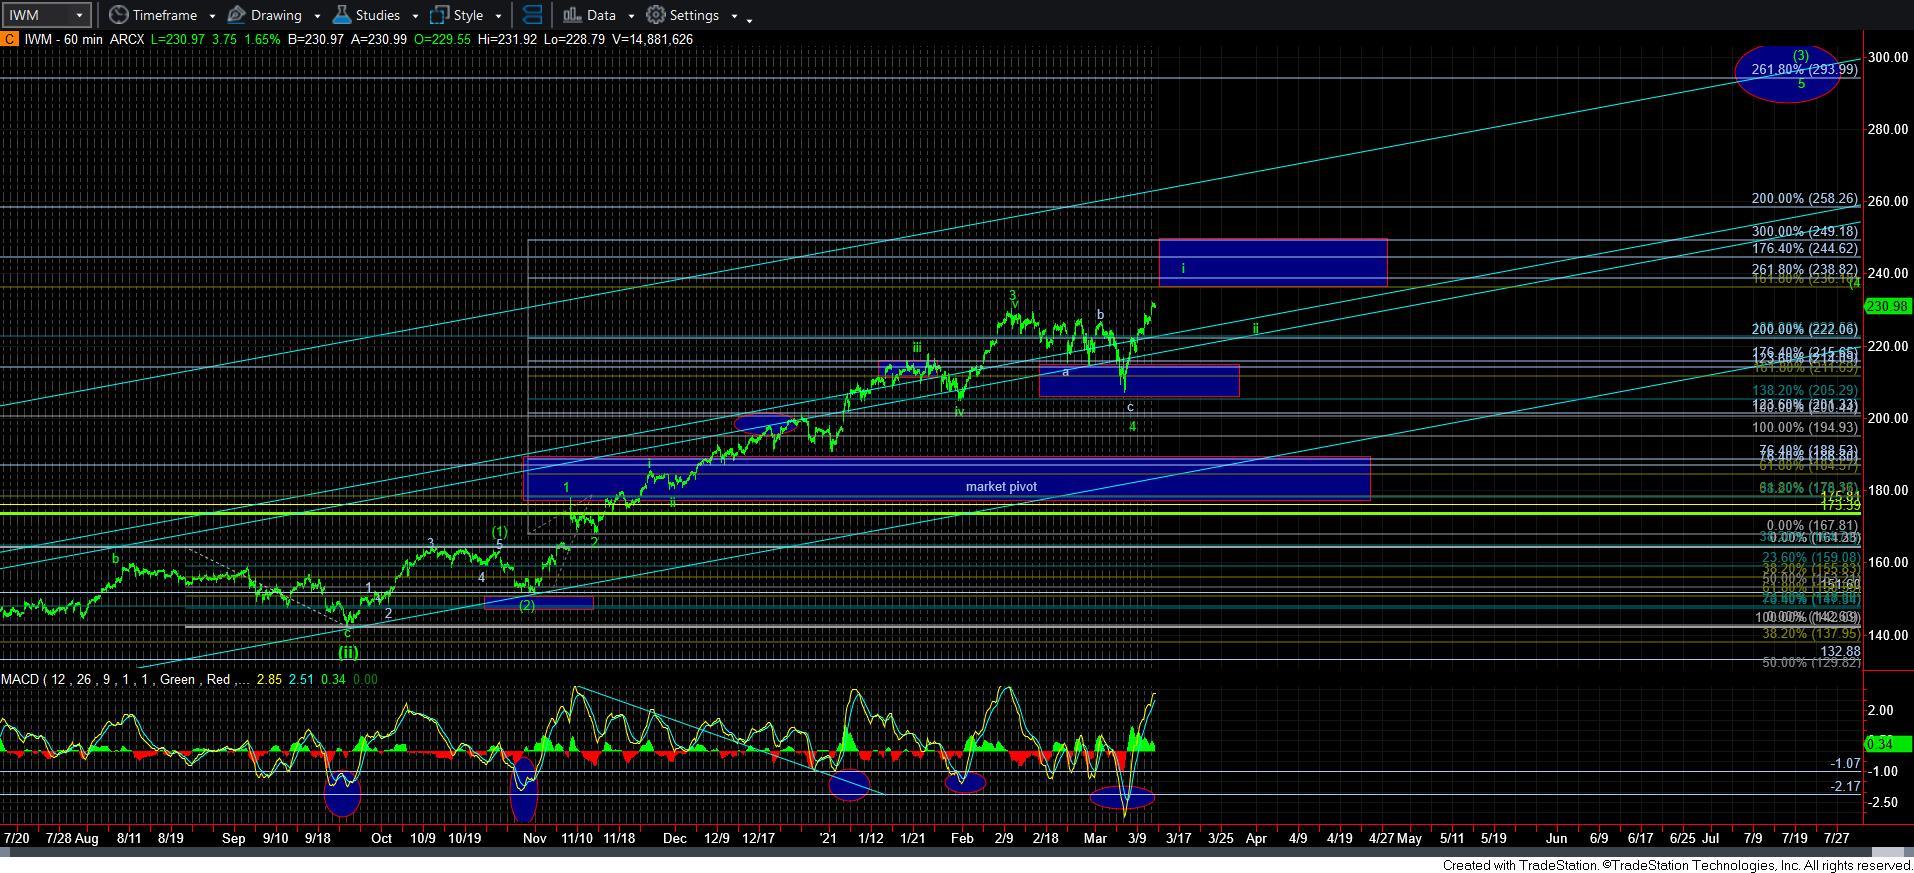
As far as the IWM is concerned, today’s action suggests that we are potentially extending higher towards the 238 region to complete wave i of 5 of [3].
Now, I want to reiterate again that this is a bull market with much higher levels likely to be struck this year. I know I sound like a broken record already, but it is what it is. Of course, the market can always provide us with a surprise and resurrect the yellow c-wave potential in the SPX in the coming week. But, with the break out over the [a]=[c] point today, I think it is reasonable to give the bulls the benefit of the doubt in a bull market, at least until proven otherwise by an impulsive break down below 3890ES.
At the end of the day, we must always remember that bull markets do bull market things. And, while there is still some potential that we can revisit the 3700SPX region again, one should only look at it as a welcome opportunity and not an expectation at this time. And, for now, I am still awaiting the 1-2 structure to set up for wave [3] before I turn extremely aggressive in anticipation of attacking the 4400+ region next.