Break Down - Market Analysis for Sep 21st, 2020
I don’t think I have to tell you that the market decided to take the more direct path to the 3200SPX region, as it made that abundantly clear with today’s action.
Before I go into my expectation as we look towards tomorrow, I want to repost something I wrote early today:
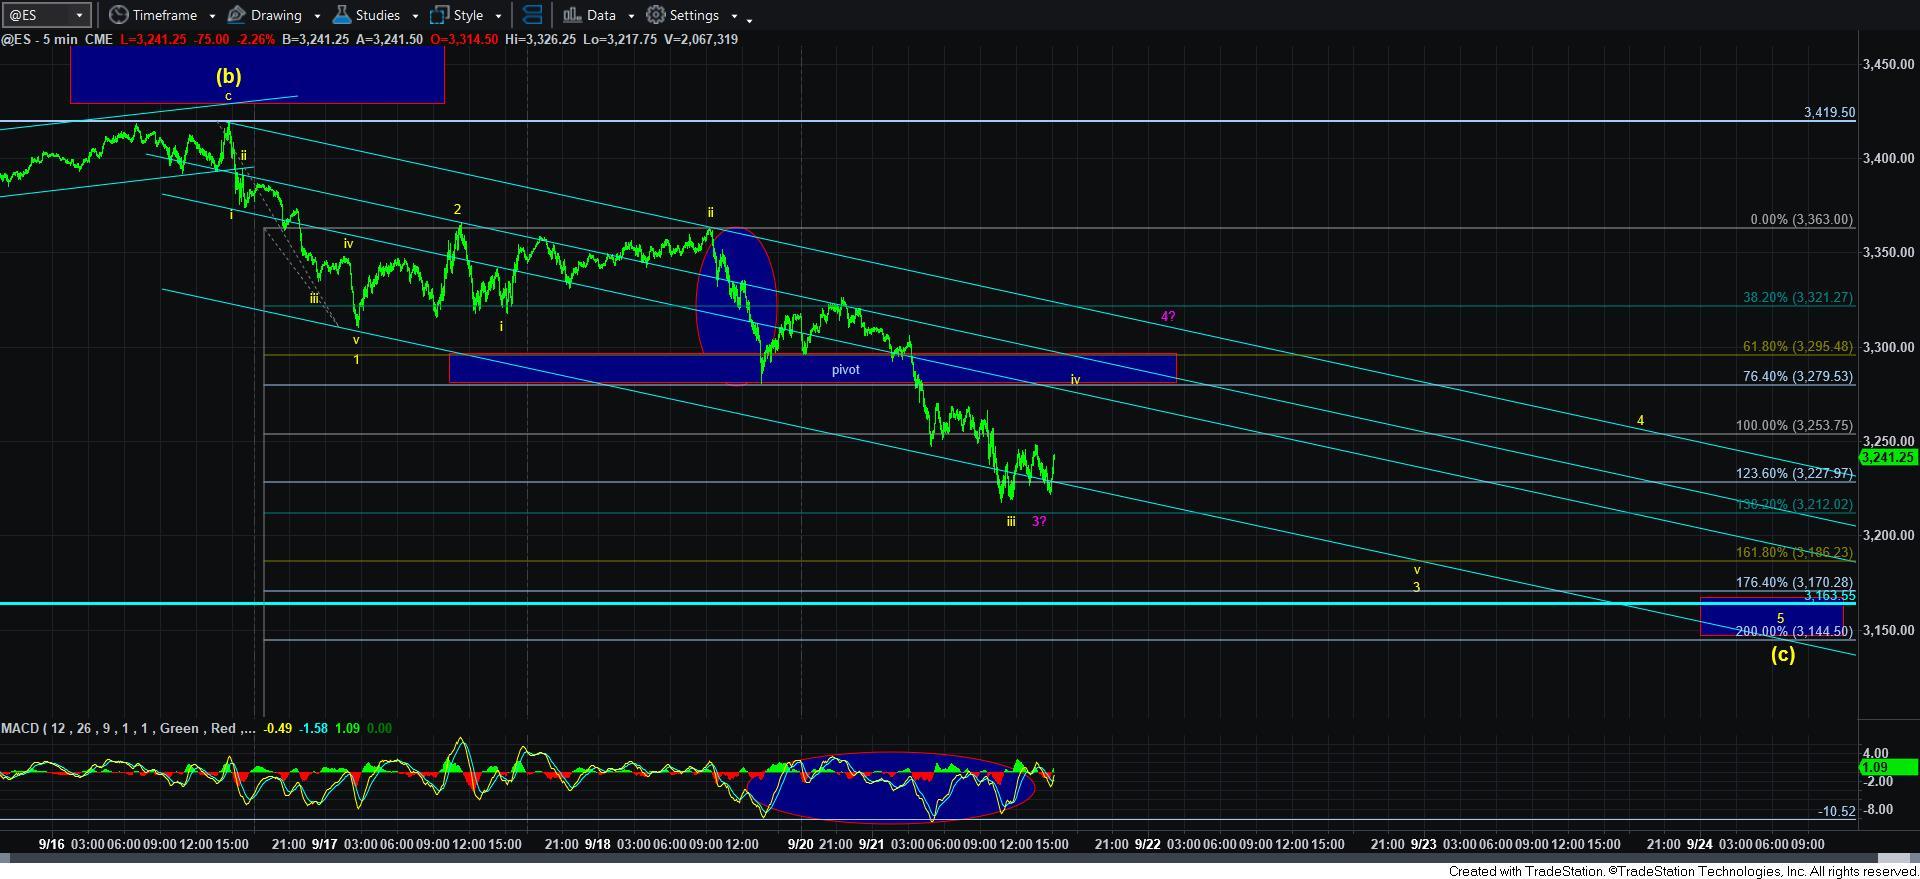
“I have spent a good part of this morning trying to figure out this downside pattern in the ES, as the structure is really not the usual Fib Pinball structure. So, the only sense I can make of it is a VERY deep wave ii as shown on this chart (the 5-minute ES chart). The reason it forces me to consider that is because the decline shown in the ellipse is really not a 5-wave structure.
So, if I am assuming this is the correct count, it means that the market has likely completed wave iii of 3 today, which means we have likely been working on wave iv of 3 for most of the day. Ideally, wave iv of 3 should target the 3280ES region, which is just beyond the .382 retracement of wave iii, and the .764 extension of waves 1 and 2, which is the common target for wave iv of 3.
Micro support is in the 3210/12ES region, and as long as we remain over that support, I would prefer to see a bigger “bounce” for wave iv, which would set up the next decline in wave v of 3 to the 1.618 extension in the 3185ES region.
Alternatively, should the market break out through the 3280ES region, then it likely means that this [c] wave is taking shape as an ending diagonal, which can take us back up towards the 3310/20ES region to complete the wave 4 in the ending diagonal, before heading down in wave 5 to the 3170ES region.
Ultimately, it means that I am expecting at least one more lower low before we complete this [c] wave decline.
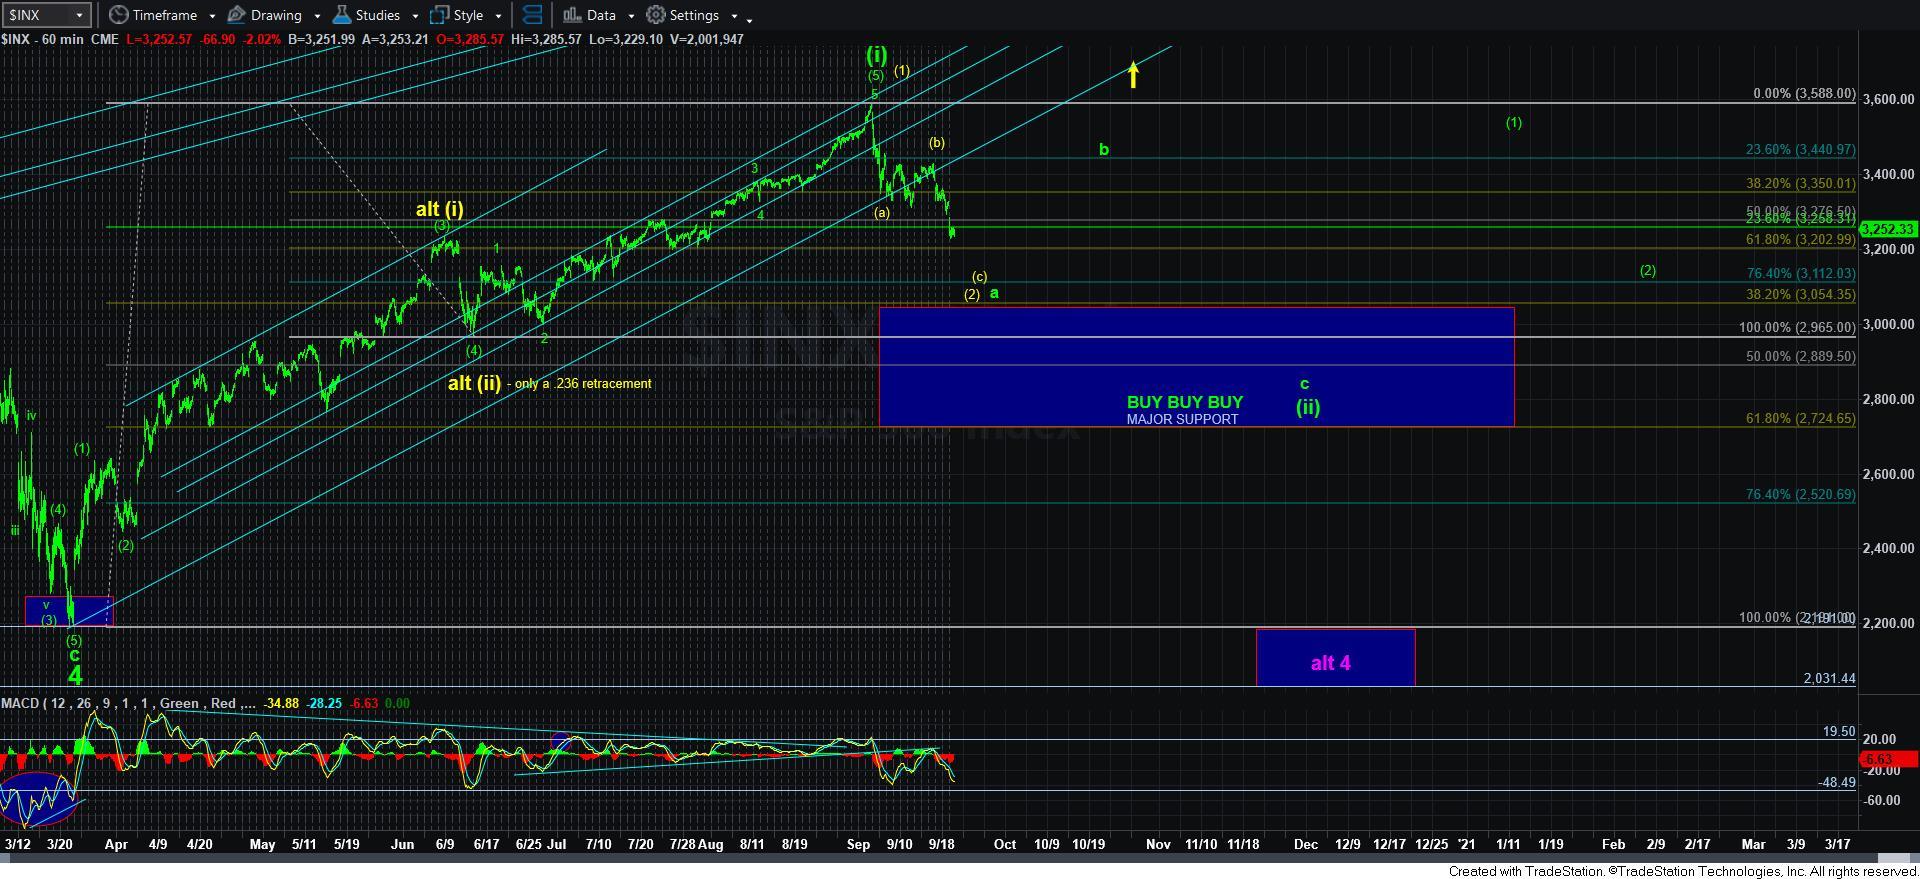
In the bigger perspective, I think we will likely complete this [a][b][c] structure off the all-time high over the coming week or so. My primary count views that as the a-wave of wave [ii], as presented in green, whereas the alternative suggests that this will be all of wave [2] of wave [iii], which is a more immediate bullish count.
Once we complete this decline, the rally thereafter will likely be the tell-tale sign between these two potentials. The green count would have us expect a corrective b-wave rally, whereas the yellow count would provide us with a very clear 5-wave rally structure.
So, for now, I still maintain my expectation for the green count, but will adjust if we see a clear 5-wave impulsive structure once this decline runs its course. So, nothing has really changed in our general expectations.