Bounce In Progress - Market Analysis for Mar 28th, 2017
Yes, I called this a “bounce” until it is proven otherwise. As you know, my primary count has this rally we expected as a b-wave rally. And, as I have noted many times before, it may even make a higher all-time high.
However, how this b-wave takes shape will often be quite complex. While the minority of times we see a straight forward pattern, this is often not the case. As I noted earlier today, and many times before as well, 4th waves are the most variable of all the Elliott structures. And, within the 4th waves, the b-wave is the most treacherous.
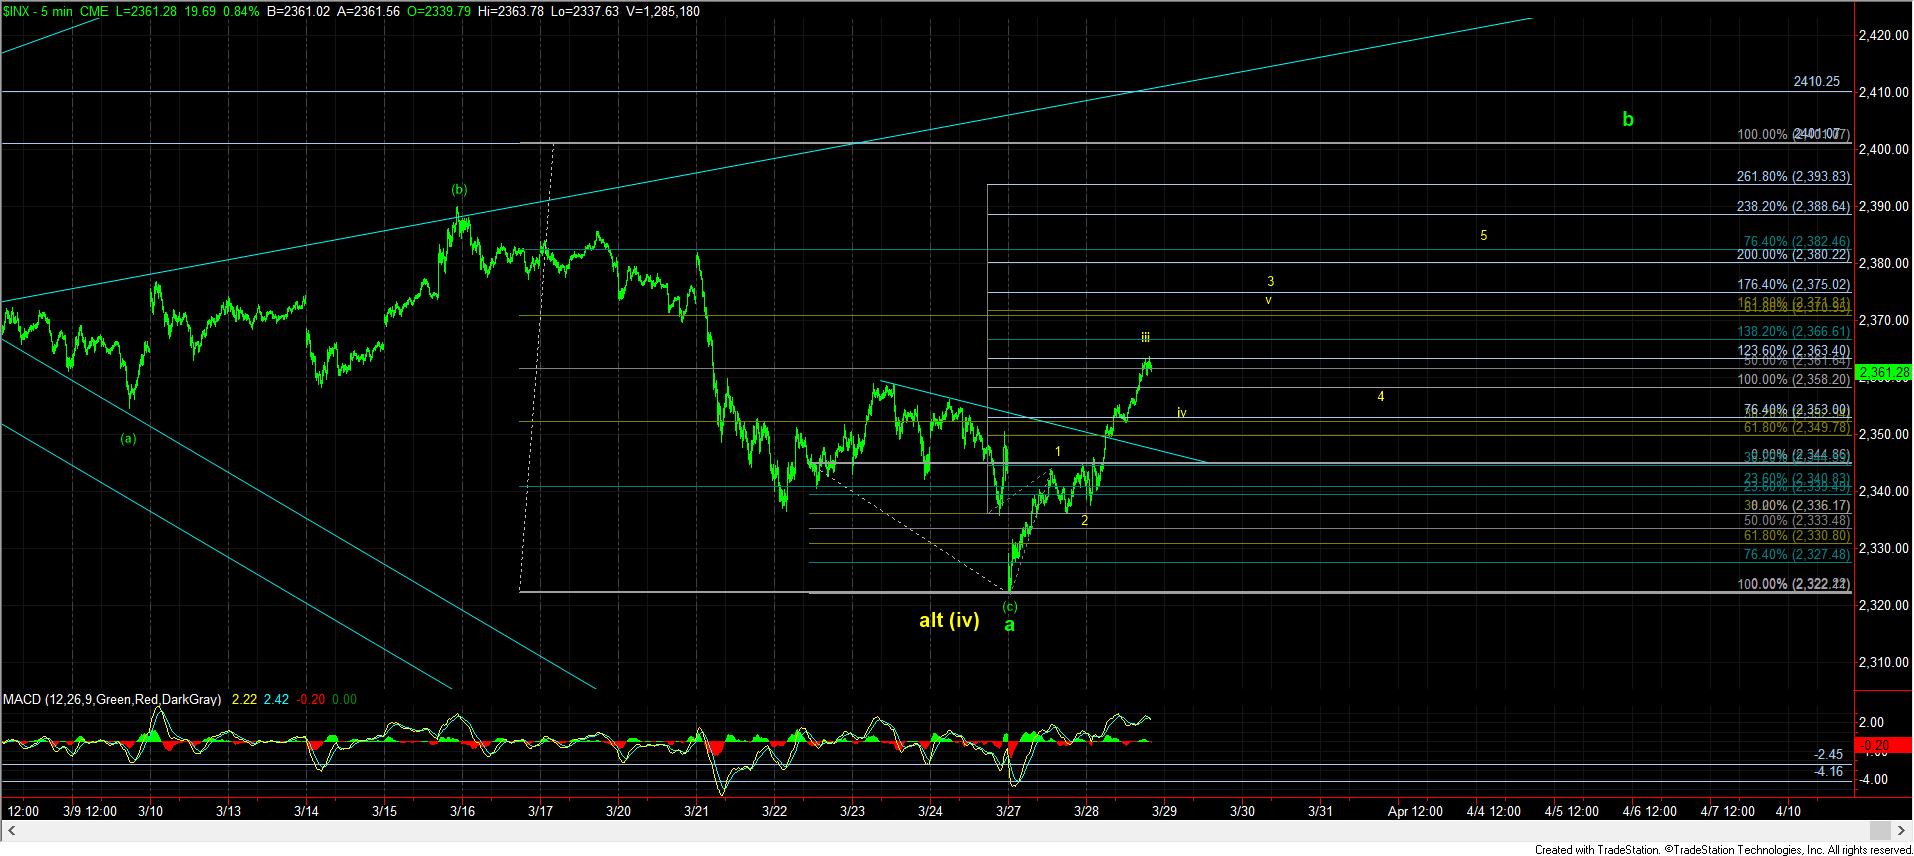
Now, as I noted over the weekend, it is possible that all of wave (iv) has been completed. And, in the attached 5 minute chart, I have outlined what I would need to see as a 5 wave structure off the lows to make me take this potential more seriously, and it is presented in yellow.
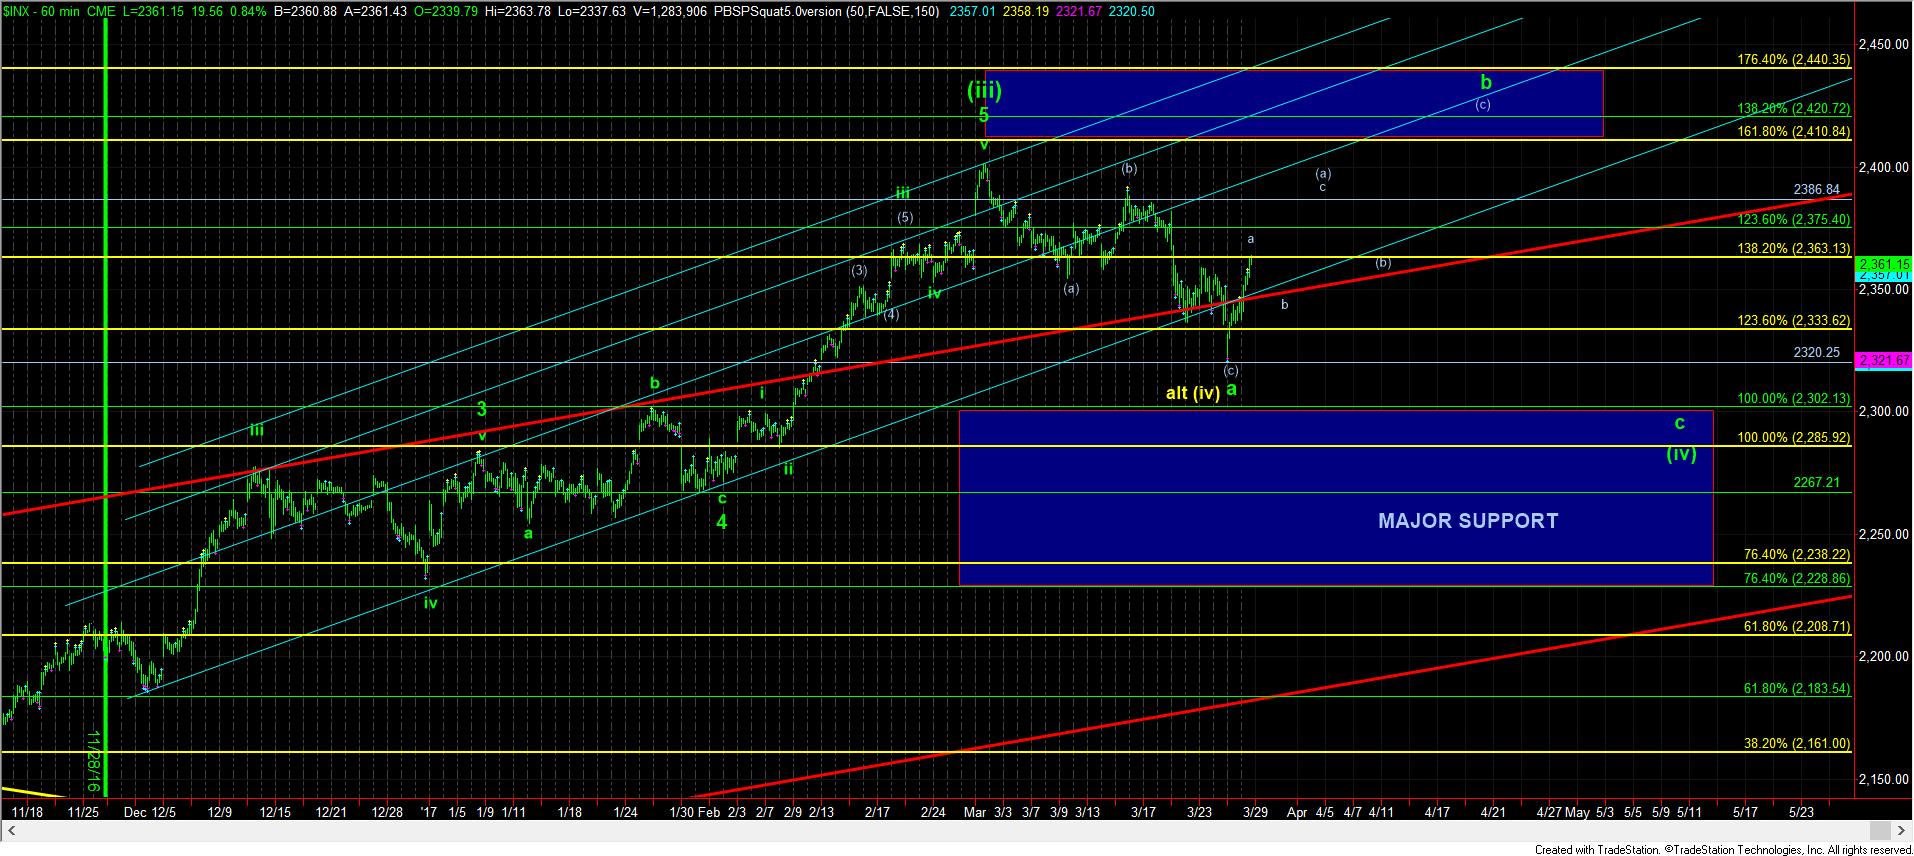
Until the market proves a more bullish pattern, I am considering the pattern I outlined on my 60 minute chart as a potential path for this b-wave, assuming we do make a higher high. But, I want to reiterate that I am making an assumption that we may make a higher high, and I am also attempting to provide a path for something that often takes treacherous twists and turns. So, please view my potential path with that in mind. As this develops more over the rest of the week, we will likely be able to develop a more accurate path.
For now, I still look at this rally as a b-wave, until the market proves otherwise. And, that means we will likely see a decline in a c-wave within the next month or so, which means we may actually see a BUY IN MAY opportunity this year.