Bottoming Signs - Market Analysis for Dec 20th, 2022
The market has been relatively predictable as we were staying below the pivot this week. In fact, right before I left for the evening yesterday afternoon, I posted the following expectation in the trading room with the chart attached below:
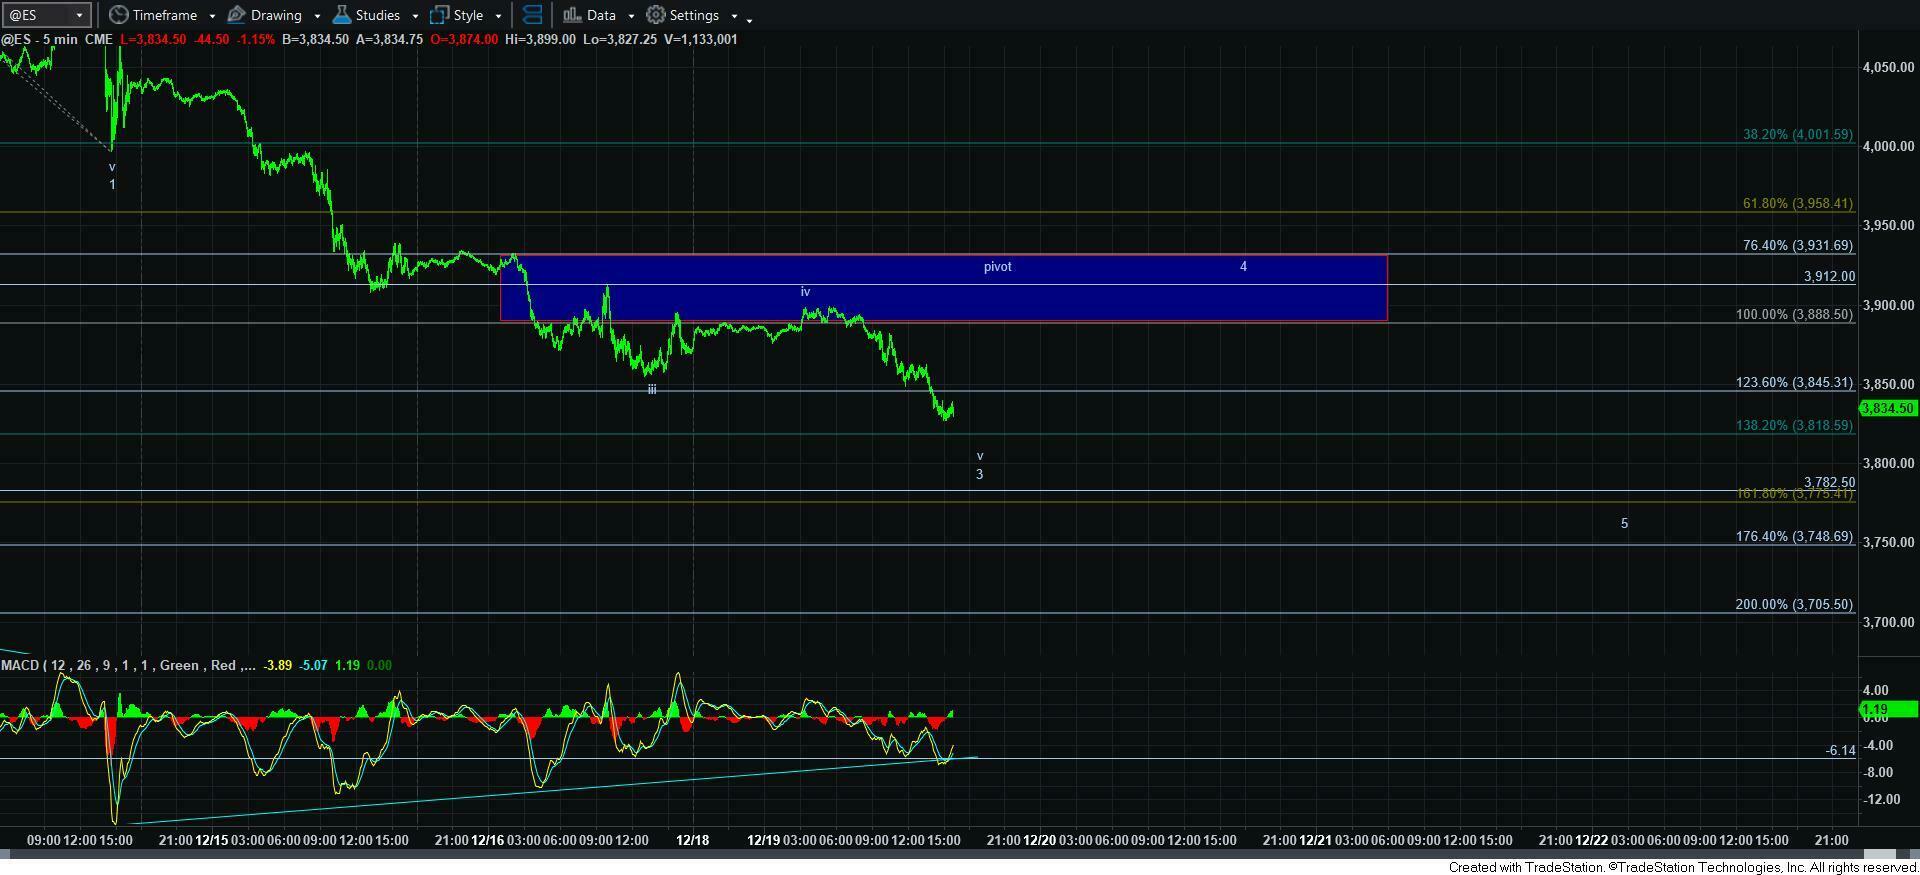
“Based upon the very micro structure, I would assume we may finish off wave v of 3 in the overnight session.”
And, as we saw, the market had some “news” hit the wires which took us down to complete wave v of 3 as expected. And, by the time the market opened, we really did not even see much evidence of that decline.
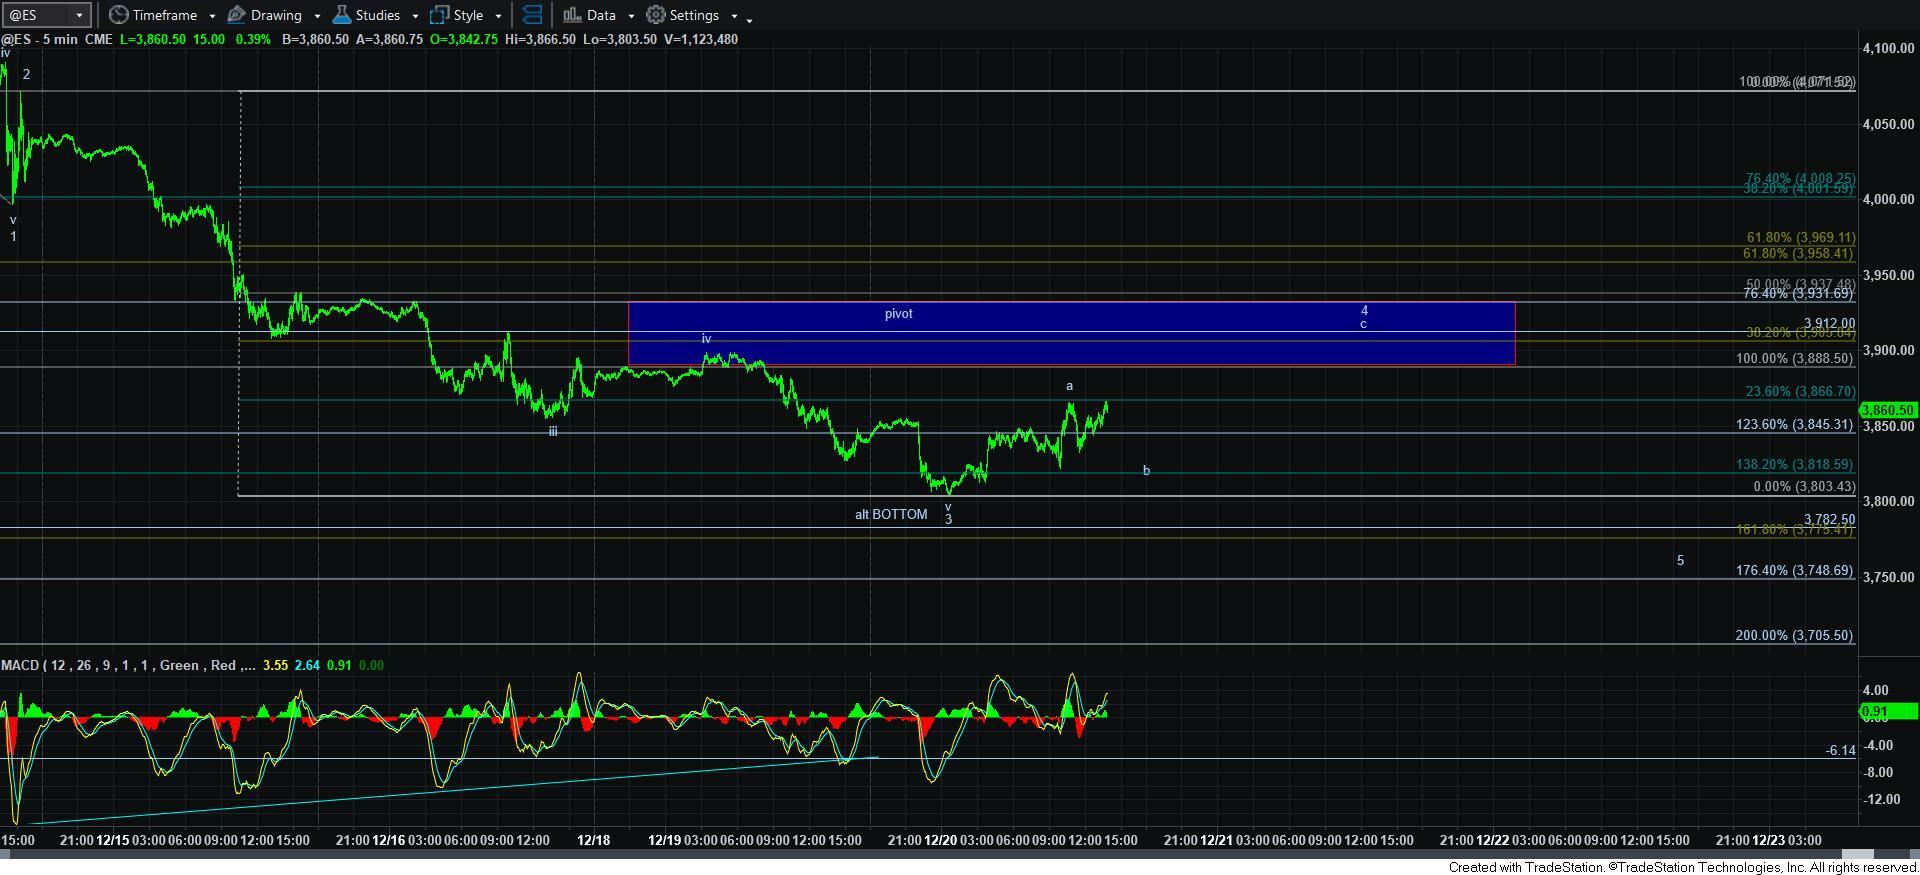
So, as it stands right now, my primary count has wave 3 of the c-wave completed, and we are now in the wave iv “bounce” back to the pivot on the 5-minute ES chart. And, in very simple terms, as long as the pivot on the 5-minute ES chart holds as resistance, pressure will remain down with the expectation of one more lower low for the 5th wave of the c-wave.
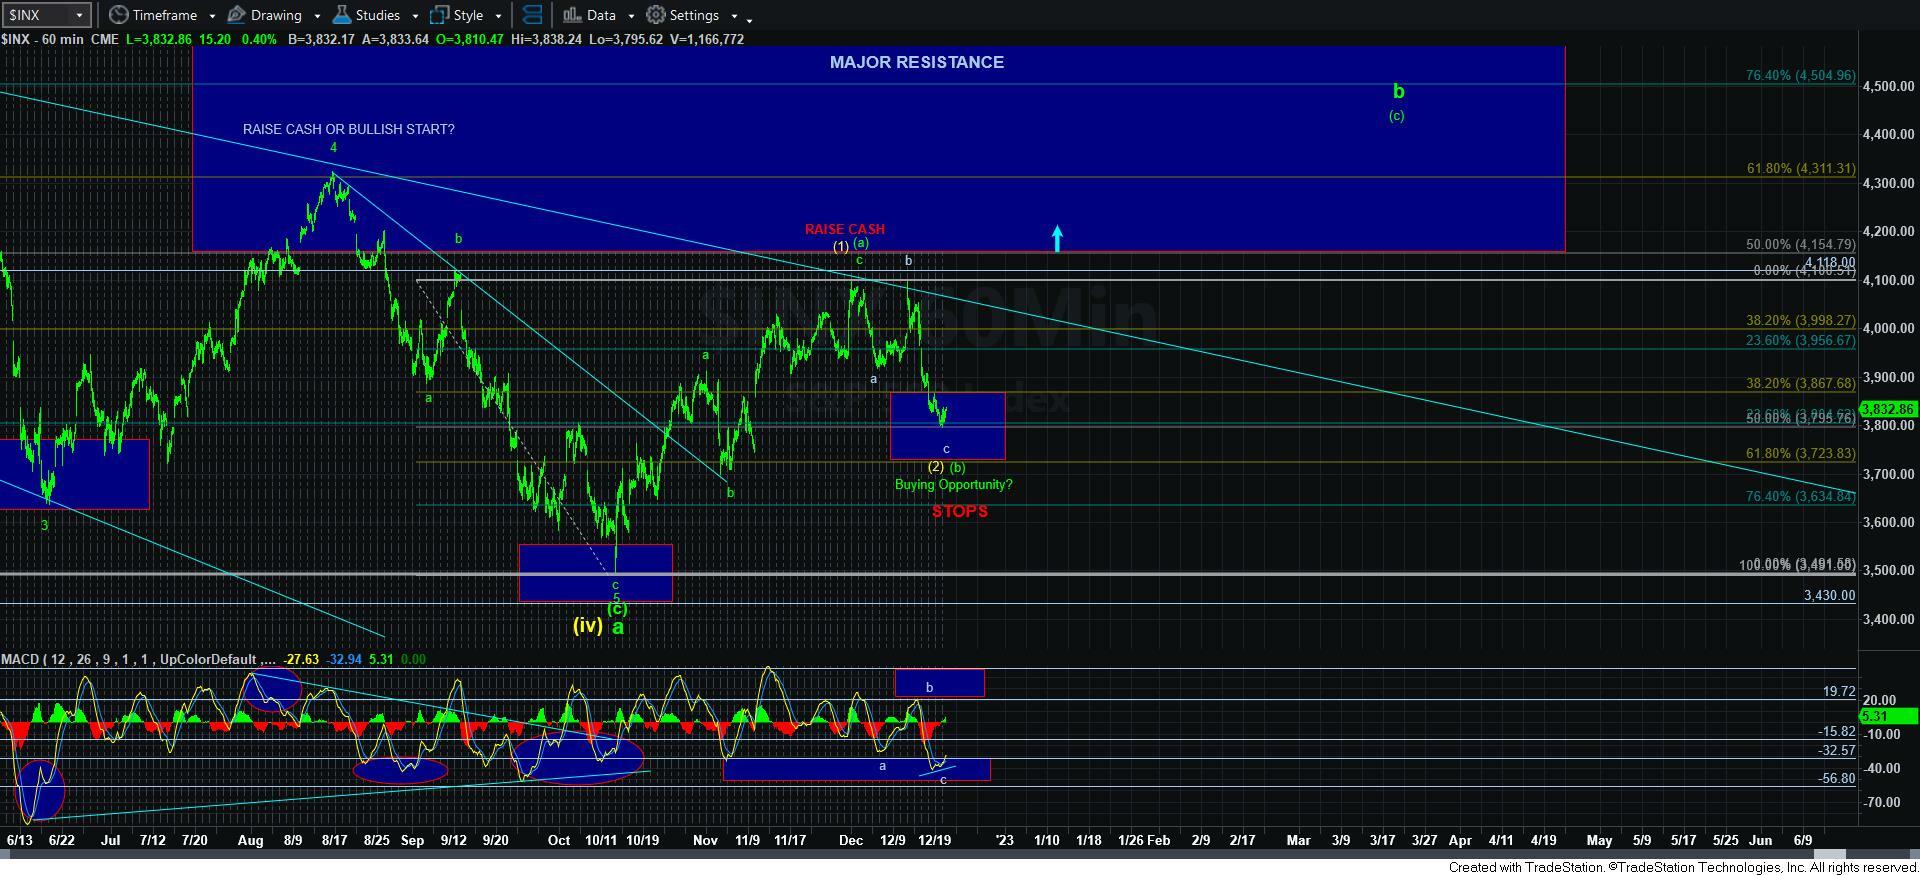
But, I want everyone to take note of the MACD on the 60-minute chart. When we struck the lows yesterday, we had a very small positive divergence evident on this chart. And, in truth, it would be the minimum amount to be seen if the bottom has already been struck. And, it was for this reason I noted that I was beginning to layer into long positions. But, now the MACD has decidedly moved off the lows, and is set up to provide us with a very nice positive divergence should we get our 5th wave lower low. But, again, that will apply for as long as the market does not break out through the pivot on the 5-minute ES chart.
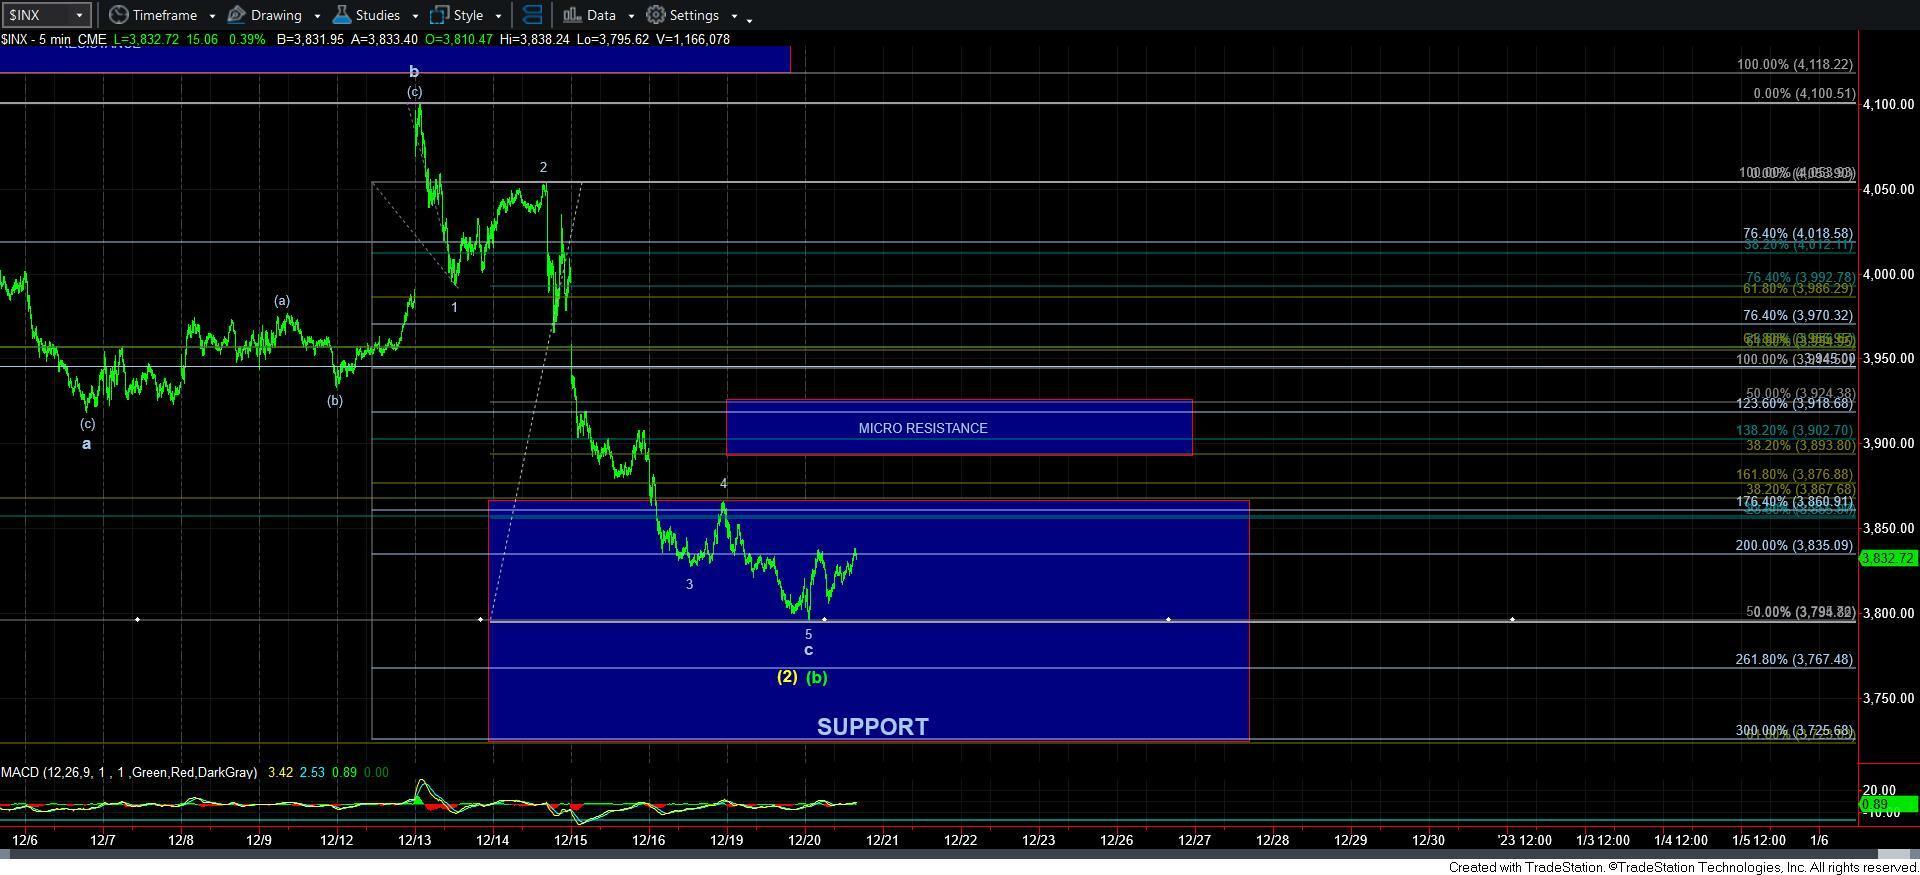
In summary, I think the market is “bottoming” out. And, my primary count has this as a [b] wave bottom, setting up a [c] wave rally to the 4300+ region. The only question is if the bottom has already been struck, or if we get that one more lower low. And, it all depends on whether the market respects the pivot on the 5-minute ES chart. My primary count is presented on the 5-minute ES chart, which is looking for a 5th wave lower low, whereas the alternative count is presented on the 5-minute SPX chart, which suggests the low is in place.