Bottoming Out? - Market Analysis for Oct 5th, 2023
Based upon the wave count, I think it is reasonable to expect a near-term bottom in the SPX. But, the question then turns to “then what?”
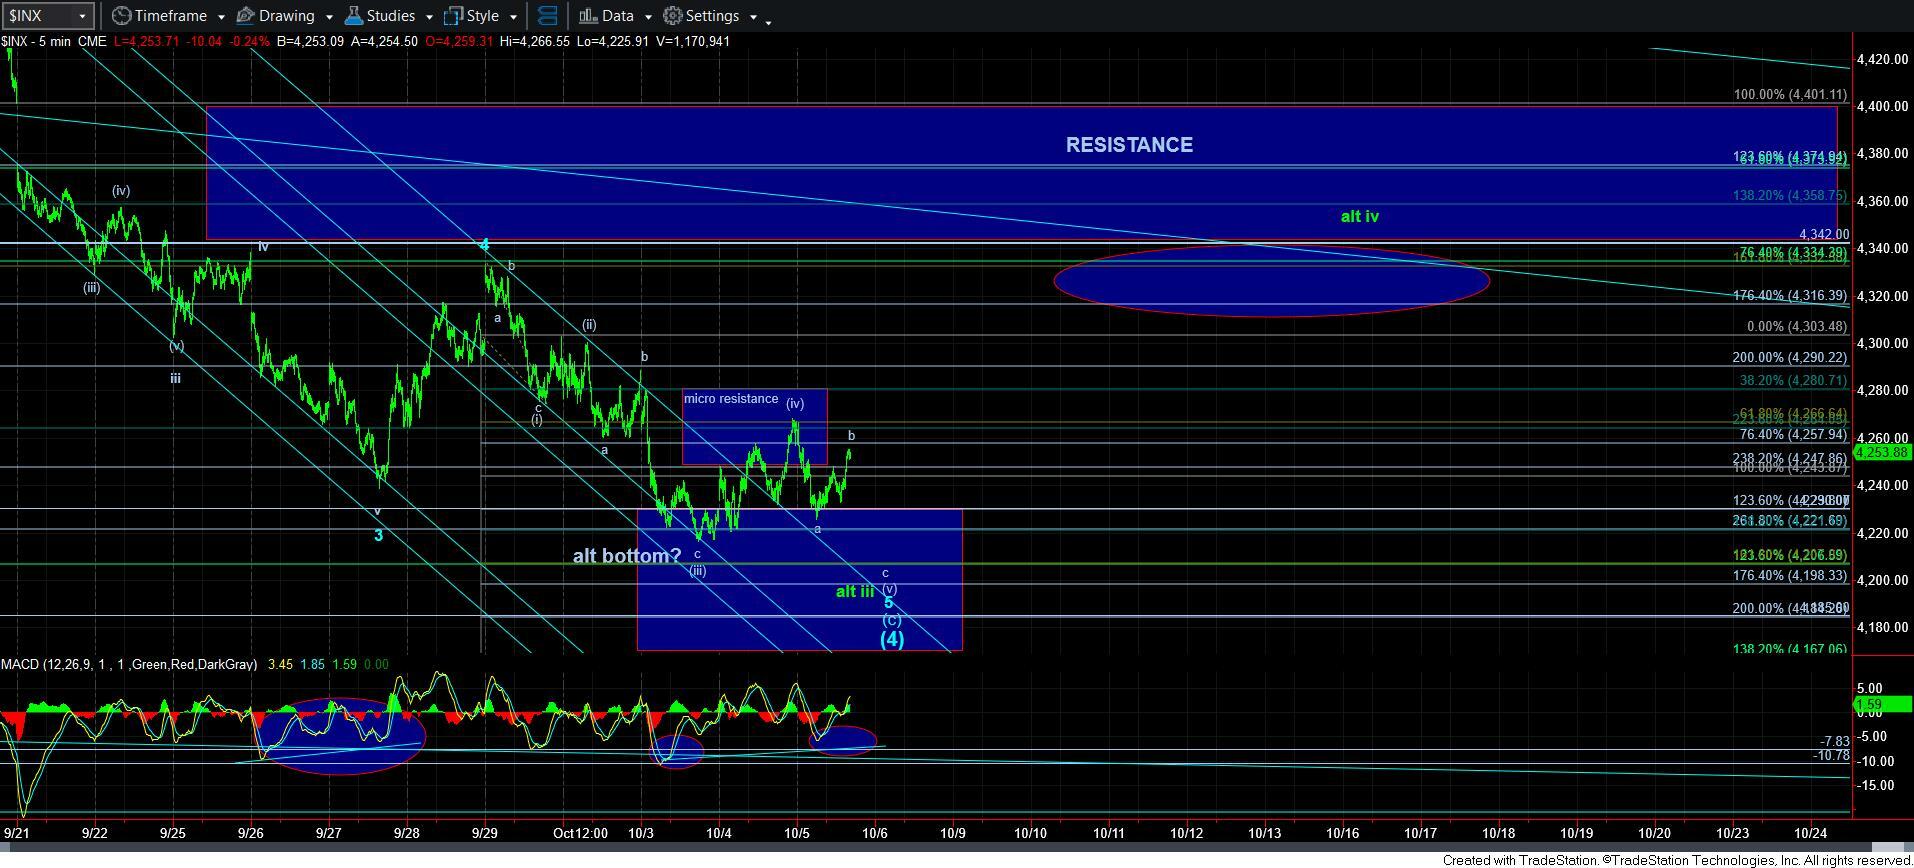
First, let’s discuss the bottoming signals. First, as long as we remain below the wave [iv] high, I have to be looking for a lower low in the coming day or so to complete this 5th wave.
However, if the market should take out the wave [iv] high, and continue through the resistance box, then we are likely pointing up towards the ellipse, and likely in a strong move. The reason I say this is based upon the potential that this last segment of the decline - wave 5 – seems to be an ending diagonal. And, we often see a sharp reversal once an ending diagonal completes, which then points us to the region of origin. That is the reason for my target being the region of the ellipse.
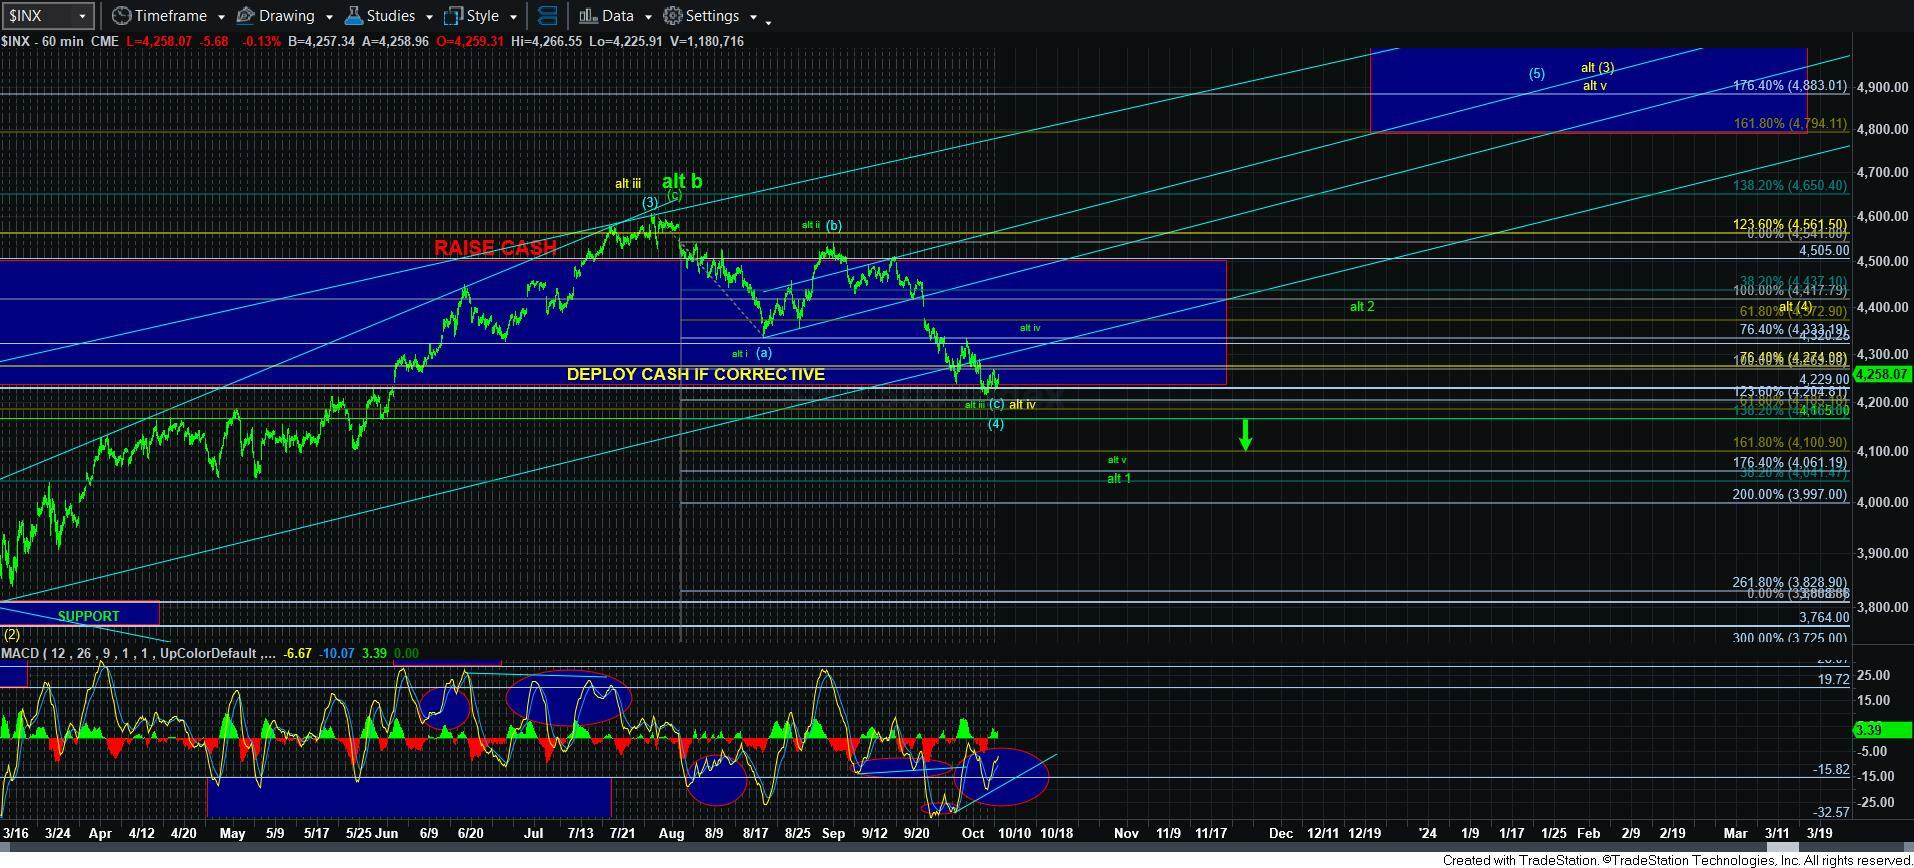
Now, once the market completes this decline and confirms it by a move to the ellipse, I am expecting one more test for the market. And, that will be to make the green count much less likely. Ultimately, we will need to see the market rally through the next main resistance in the 4375-4401SPX region to make that green count much less likely. And, it would take a rally through 4541SPX to completely invalidate it.
So, my overall expectation remains an expectation for a near term bottom to be struck over the 4165SPX support, followed by a rally back to the ellipse on the 5-minute chart. My primary view remains that this would the start of the rally to 4800SPX.
However, should we see such an initial rally in the coming week, but then we break back below whatever low we create down here, that will bring the green count to the forefront and be a strong indication that a b-wave high is already in place, and that we are likely completing a larger degree leading diagonal down from 4607SPX for wave 1 of a c-wave, which will ultimately be pointing us down to the October 2022 lows, and potentially lower. Again, until proven, this remains my alternative.


