Bottom Not Confirmed - Market Analysis for Feb 9th, 2020
I am going to again begin the USO analysis with the outline of my larger degree expectations in the USO:
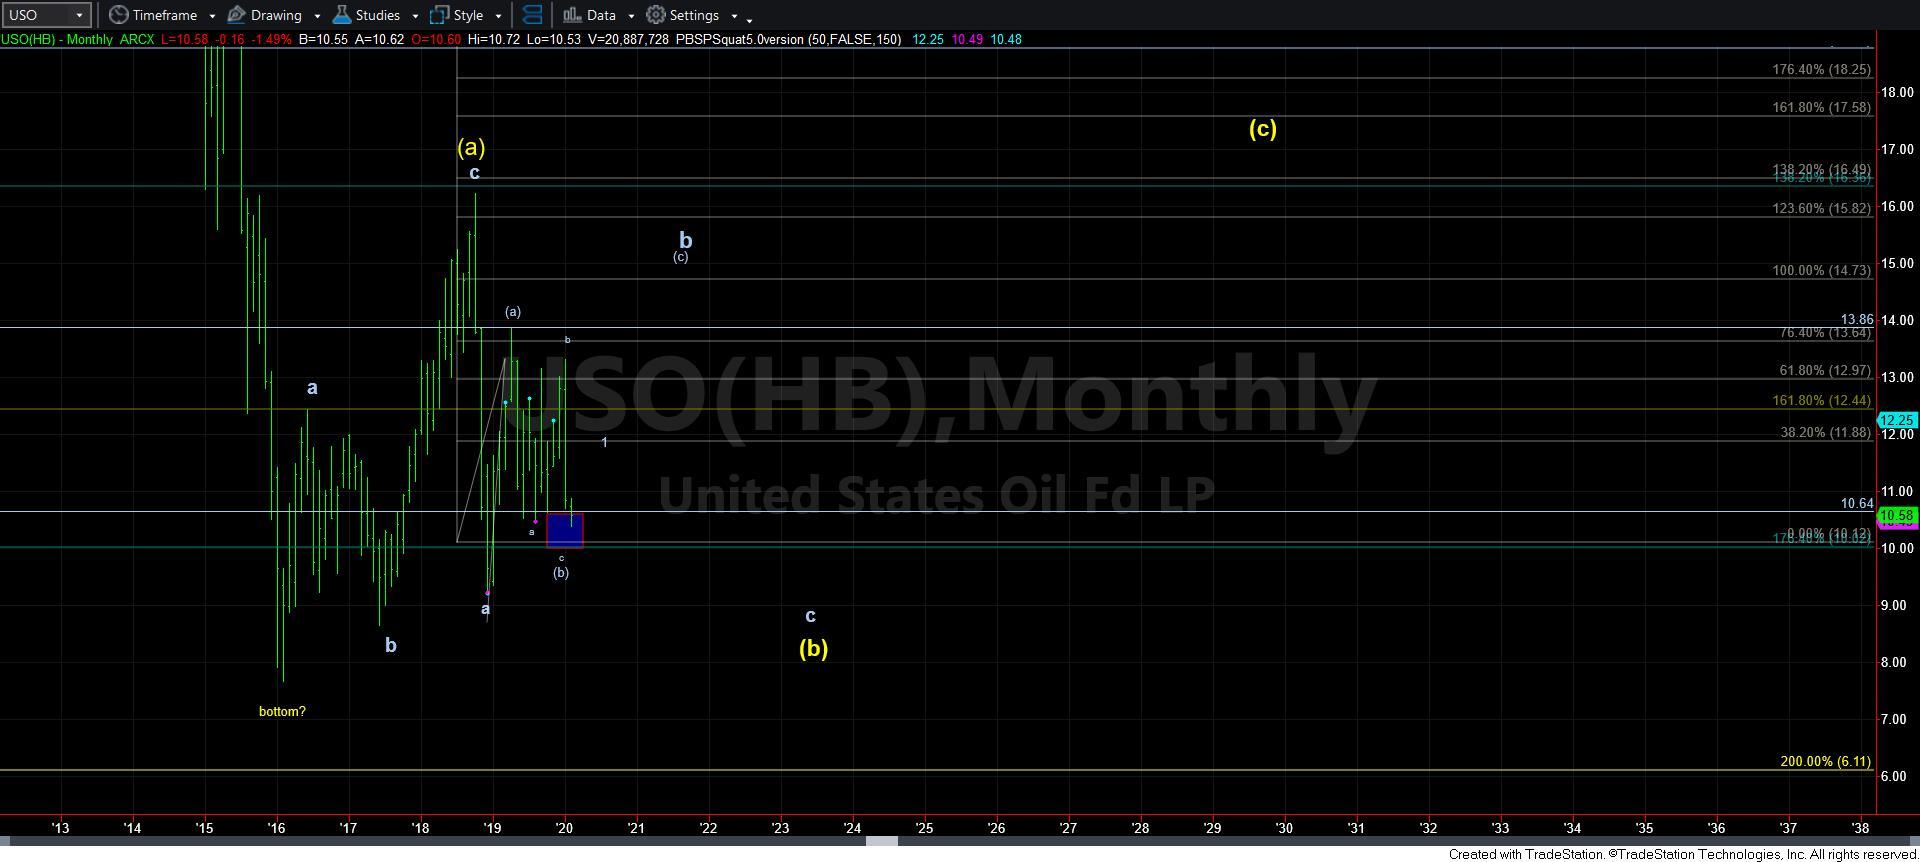
With the USO pushing us even higher this past week, I wanted to take a step back and explain to you what I am seeing in the bigger picture on the chart. Once you look at the attached bigger time frame chart, you will understand why I am not terribly bullish of the USO.
Since we bottomed back in early 2016, you can see that the USO has been presenting us with a very overlapping and corrective structure. In fact, most moves have been tracking as 3-wave corrective structures. And, as R.N. Elliott explained to us, corrective structures are quite variable in nature, and make trading them quite difficult.
As you can see from the attached chart, I am viewing us as being within the heart of a very large degree b-wave off the 2016 low. And, the problem with the b-wave structure is that it typifies Elliott’s view of variability within corrective structures. This is why we have basically been going sideways for the last year.
And, as you can also see from the chart, my primary expectation still remains to be on the lookout for a c-wave down within the very large b-wave structure. But, before I am able to view that c-wave decline as being more likely, I still need to see a 5-wave structure develop to the downside. Keep in mind that c-wave structures are commonly 5-wave structures, which is why I am awaiting an initial 5-wave downside structure to begin the larger 5-wave c-wave down that I still expect.
This larger degree understanding of the USO market comes from the attached monthly chart I have been sending out for the last several months. It provides a bigger picture outlook as to what I am expecting.
But, please keep in mind that the monthly chart is outlining a very corrective structure which can take us a decade or so until it completes. In the meantime, we will see various c-wave set ups which can provide a nice trading opportunity. It is for such an opportunity that I have been focusing my analysis on of late.
As you can see from the monthly chart, we have now moved into the target I had to complete The blue box represents the .764-1.00 extension of the micro a-b-c structure. Meaning, the upper part of the box represents the point where the c-wave would equal to .764 times the size of the a wave – all within that [b] wave target box I have on the monthly chart. And, the bottom of the box provides us with the a=c target.
Moreover, once this bottoming structure has completed, my expectation is to see another [c] wave rally to complete the larger degree b-wave on my monthly chart.
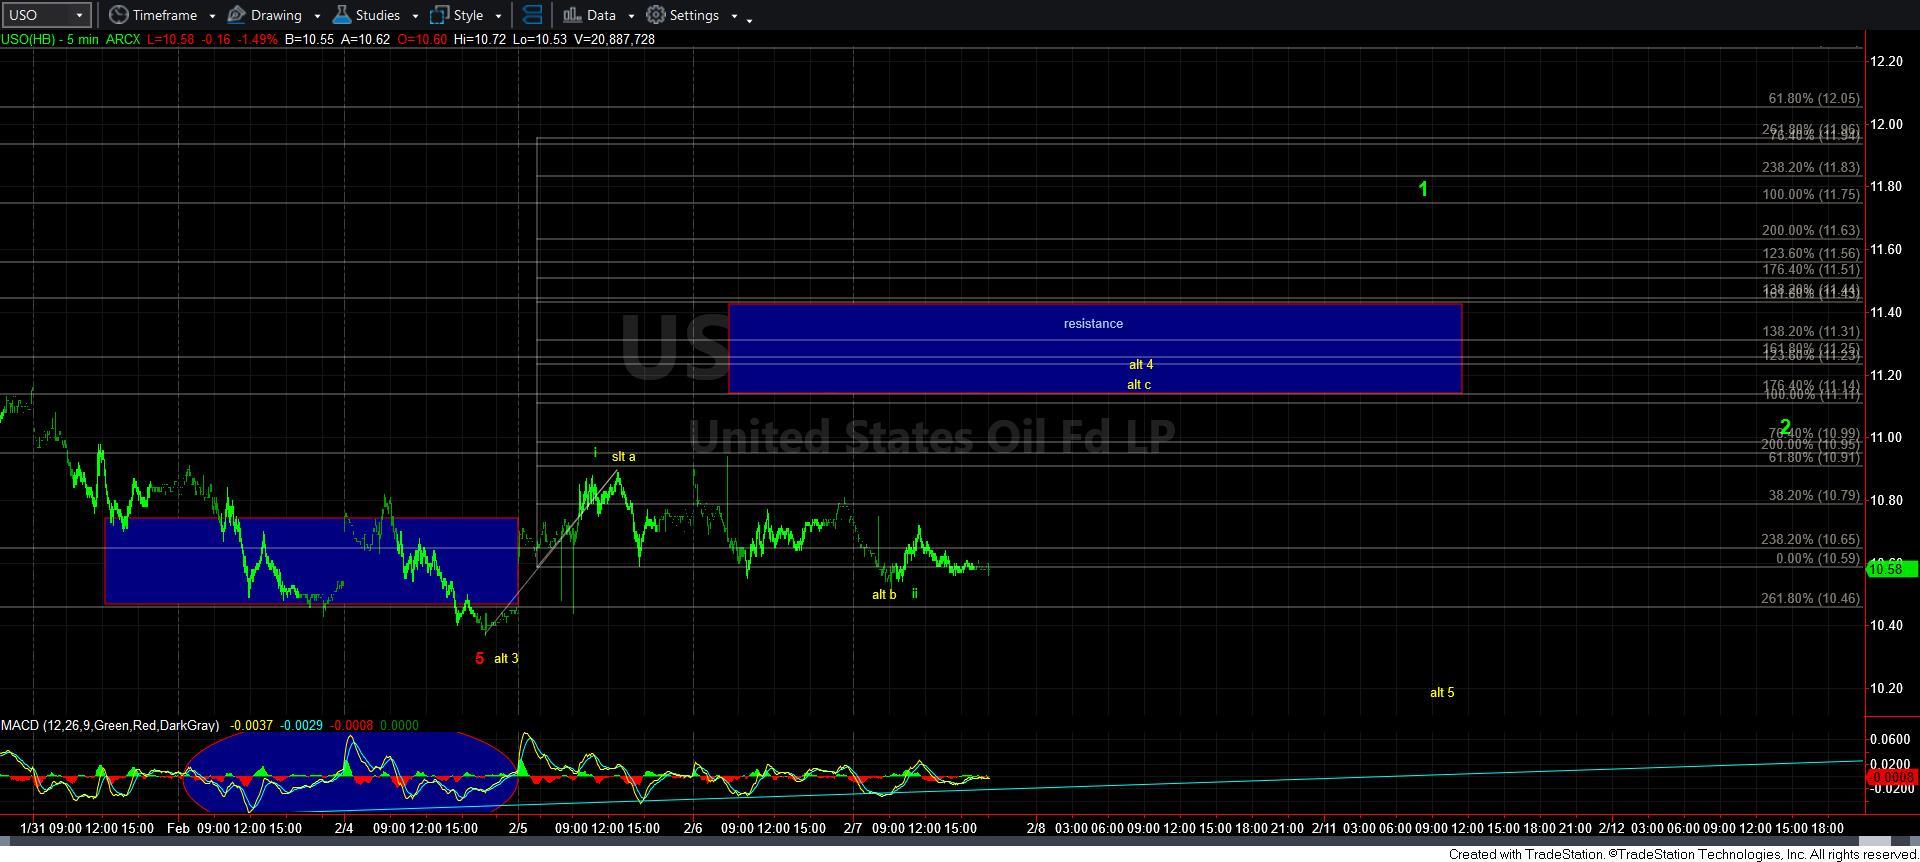
Therefore, until the market is able to provide us with an impulsive structure for wave 1 (as shown on the 5-min USO chart, I cannot confidently say that we have yet bottomed. In fact, the depth of the pullback which continued into Friday is making it a bit less likely that we have struck the bottom. So, unless we see an impulsive 5-wave move beyond the resistance box noted on the 5-minute chart, I can maintain a reasonably probable expectation that the market may try to hit that 10 region before it bottoms out.