Blue Is Still Alive
If I told you that I got the GDP report the day before it was announced, and it showed that GDP came in almost half of the expectations, 99% of those I would tell would automatically assume that the market would drop hard after it was announced. Yet, here we are with a 1.3% rally as I write this update.
So, I am going to repost the brilliant words of Bob Prechter one more time, as it is always worth repeating:
“Observers’ job, as they see it, is simply to identify which external events caused whatever price changes occur. When news seems to coincide sensibly with market movement, they presume a causal relationship. When news doesn’t fit, they attempt to devise a cause-and-effect structure to make it fit. When they cannot even devise a plausible way to twist the news into justifying market action, they chalk up the market moves to “psychology,” which means that, despite a plethora of news and numerous inventive ways to interpret it, their imaginations aren’t prodigious enough to concoct a credible causal story.
Most of the time it is easy for observers to believe in news causality. Financial markets fluctuate constantly, and news comes out constantly, and sometimes the two elements coincide well enough to reinforce commentators’ mental bias towards mechanical cause and effect. When news and the market fail to coincide, they shrug and disregard the inconsistency. Those operating under the mechanics paradigm in finance never seem to see or care that these glaring anomalies exist.” – Bob Prechter. The Socionomic Theory of Finance
Now, on to the market action.
After the action these last few days, it seems almost everyone was throwing the potential for a rally to 4300SPX out the window. And, it reminds me of something Mark Twain once said when a newspaper mistakenly published that he had died:
“The reports of my death are greatly exaggerated.”
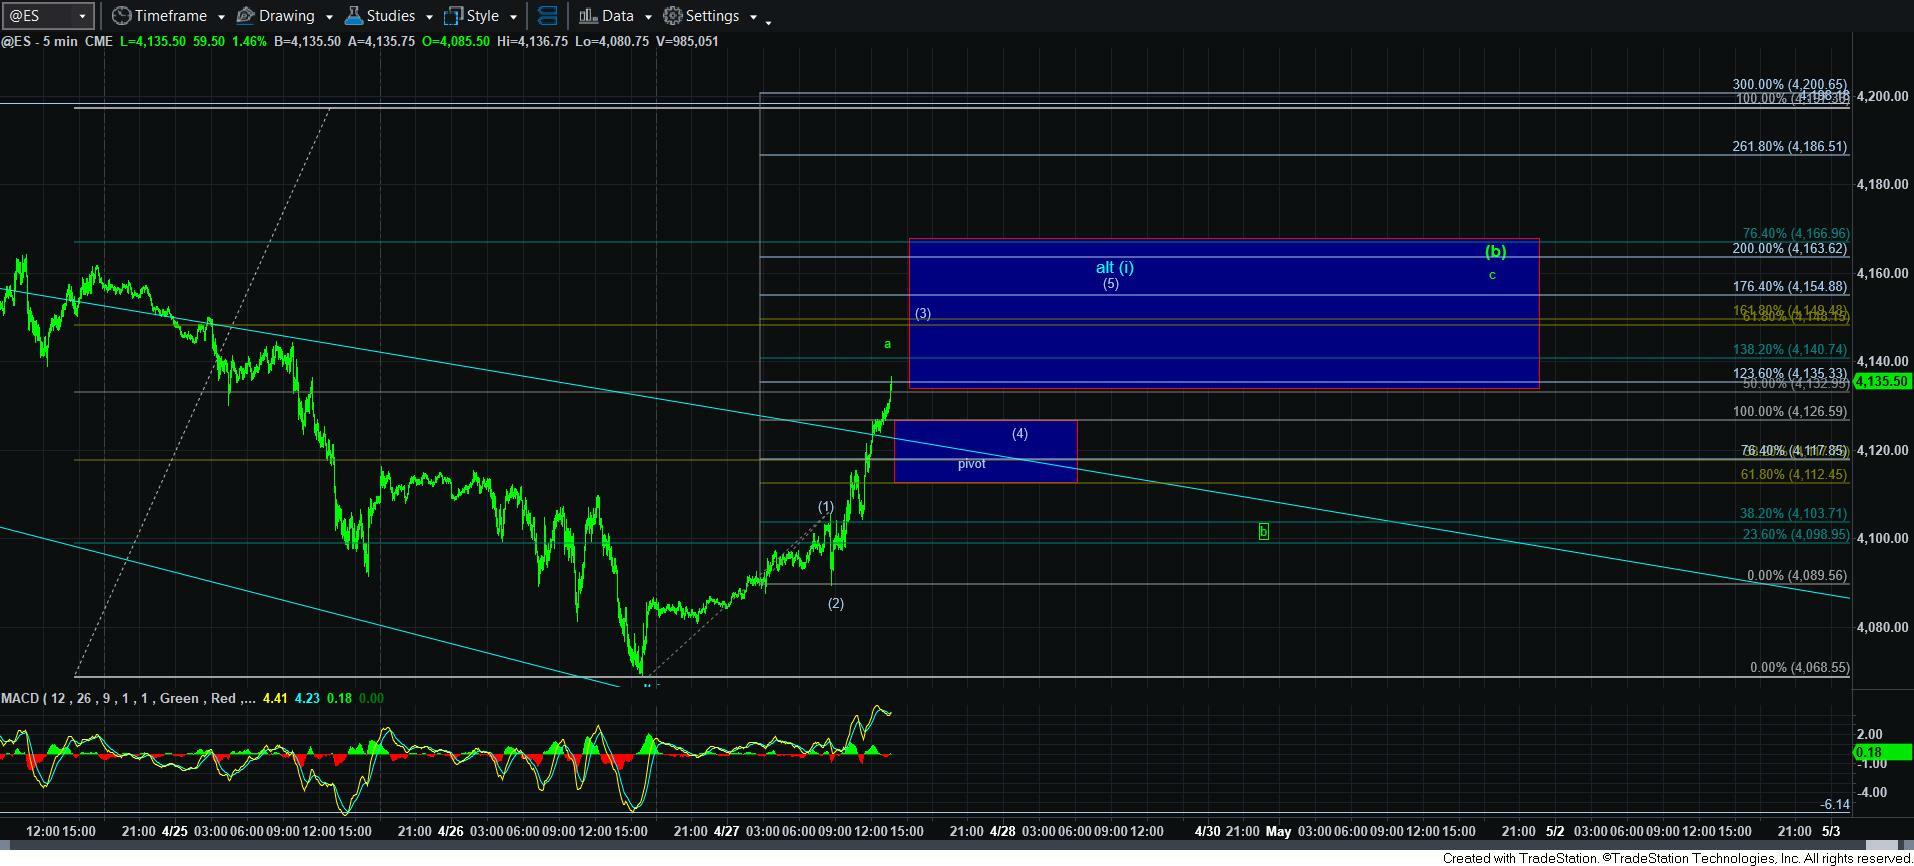
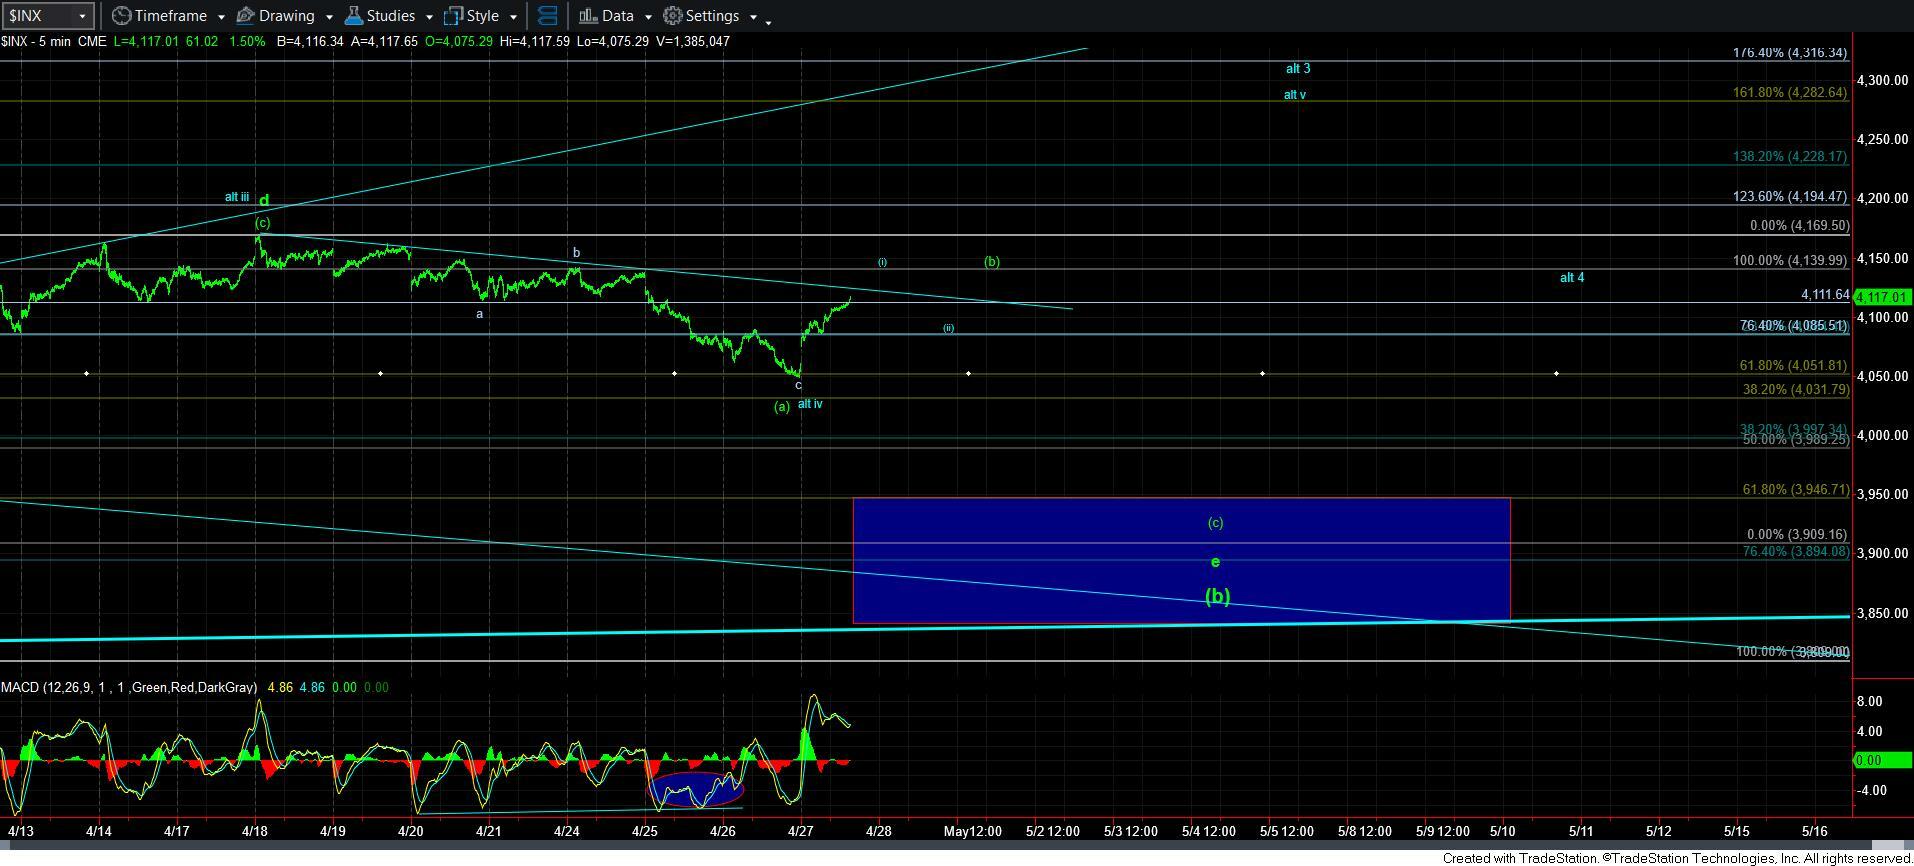
Yes, the blue count is still just holding on. And, as I write this update, we have a potential path for a 5-wave rally off yesterday’s pullback low at the .618 extension in the 4050SPX region (with the actual low being struck at 4049.35). As I write this update, there is potential that the market is in the wave [3] of wave [i] of wave of wave v of 3 in the blue count. You can see the smaller degree potential structure on the 5-minute ES chart. And, on the 5-minute SPX chart, you will see the proposed [i][ii] structure that can project to the 4282SPX region for wave v of 3 in the blue count.
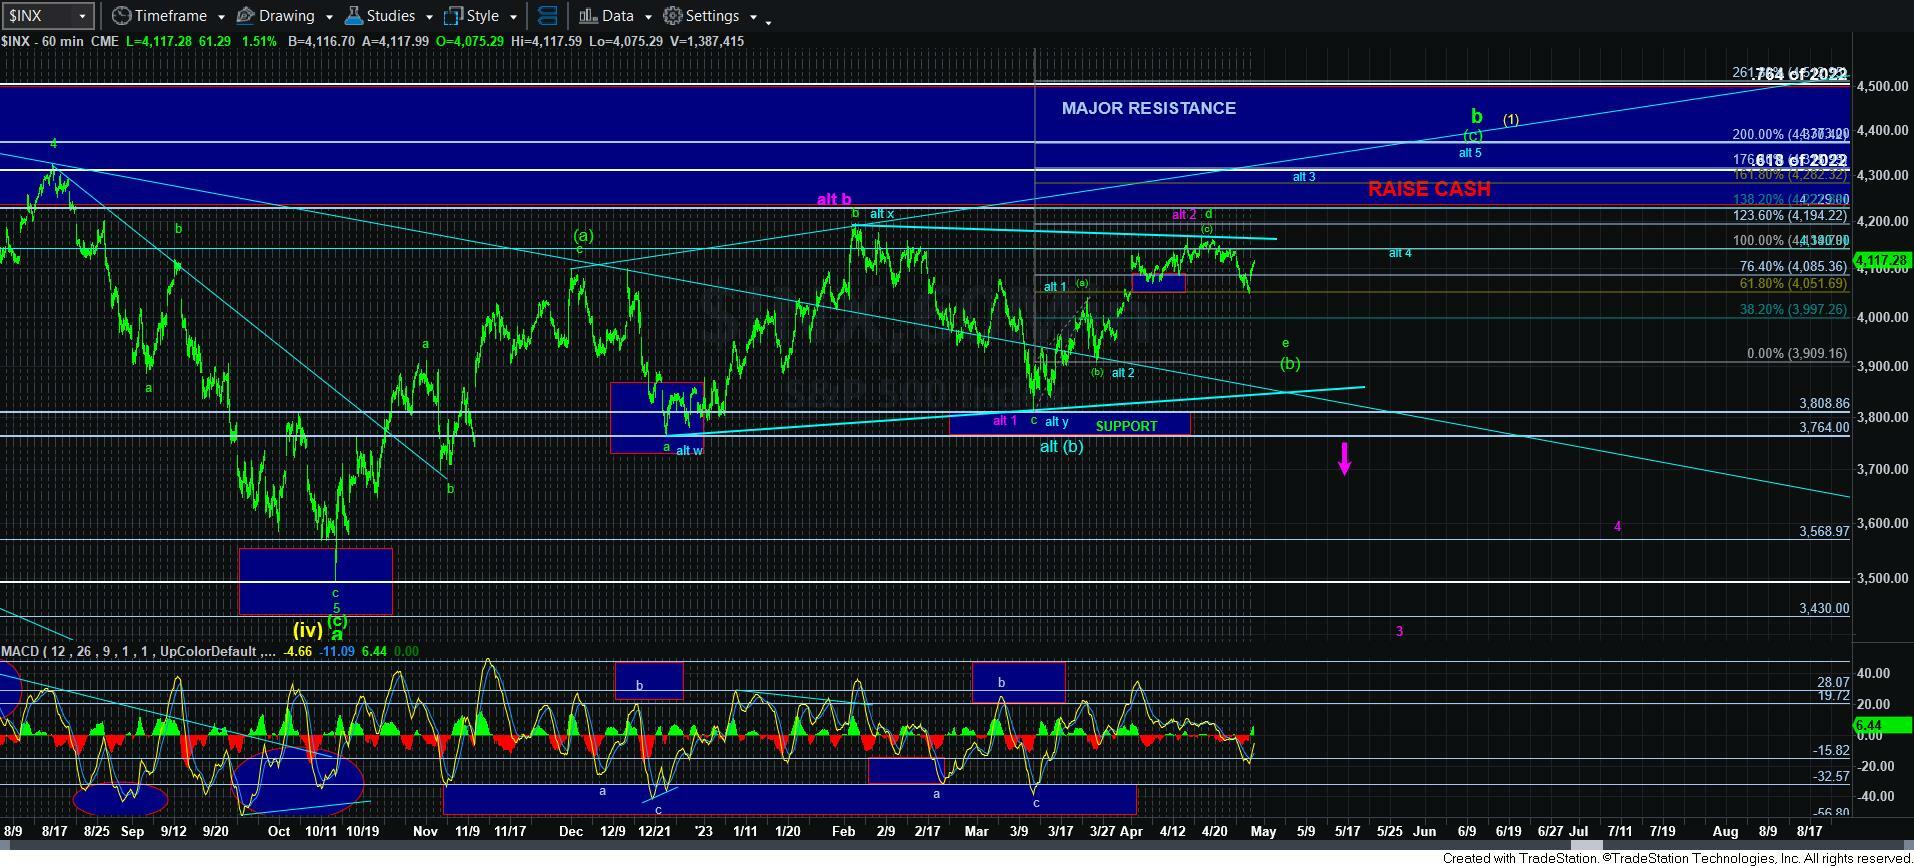
But, remember, in order for me to adopt the blue alternative count as my primary count, I will need to see all 5 waves complete as shown, and then see a corrective wave [ii] pullback. Should we see that in the coming days, and then see a break out over 4195SPX, then I will abandon the triangle and purple counts, and be looking to complete waves 3, 4 and 5 as shown in blue up towards the 4316-4370SPX region in the coming weeks.
In the meantime, should the market fail to complete 5 waves up, then it will keep me in the [b] wave triangle count, which would suggest this rally is the [b] wave in the e-wave of the [b] wave triangle count, which can be seen on the 5-minute SPX chart as well.
I am assuming we should finally be approaching resolution of this region very soon.