Bigger Consolidation Aligning Across Markets
Not often do you see a similar type of consolidation occur across markets. Yet, that is what I am seeing at this time.
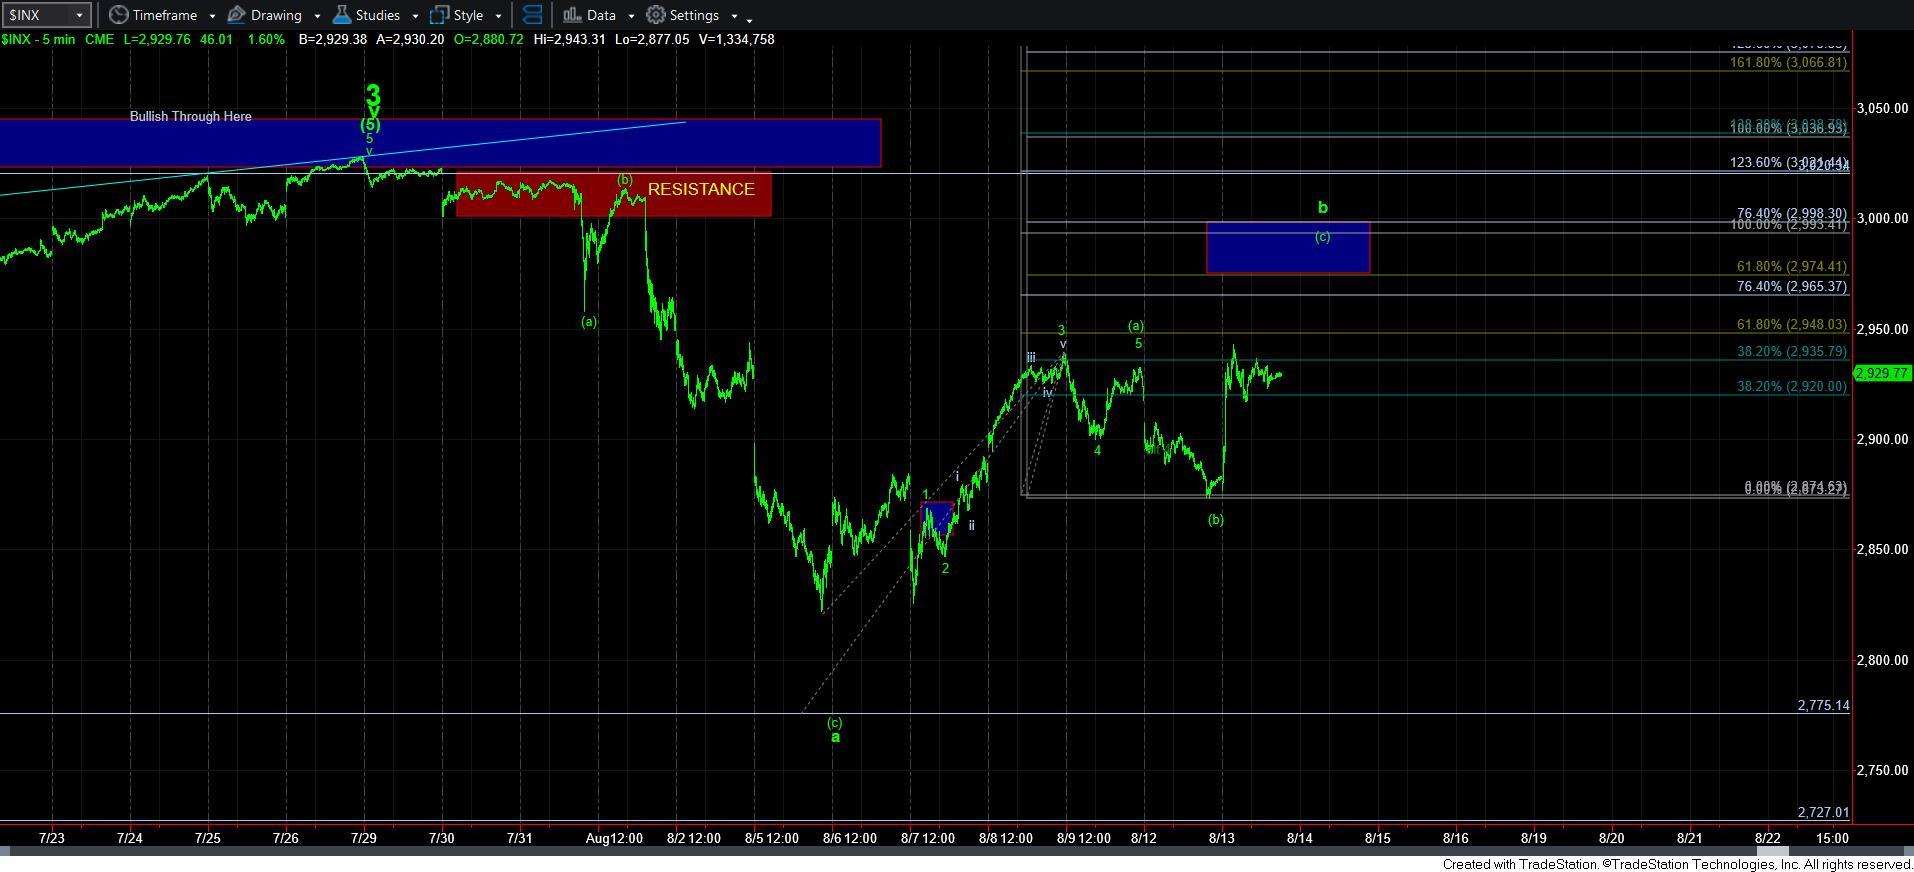
But, before I go into that discussion, I think it is rather clear that the market has taken the alternative path laid out by Mike in his update yesterday. The b-wave has not yet completed, and we see to be in the c-wave of that larger structure.
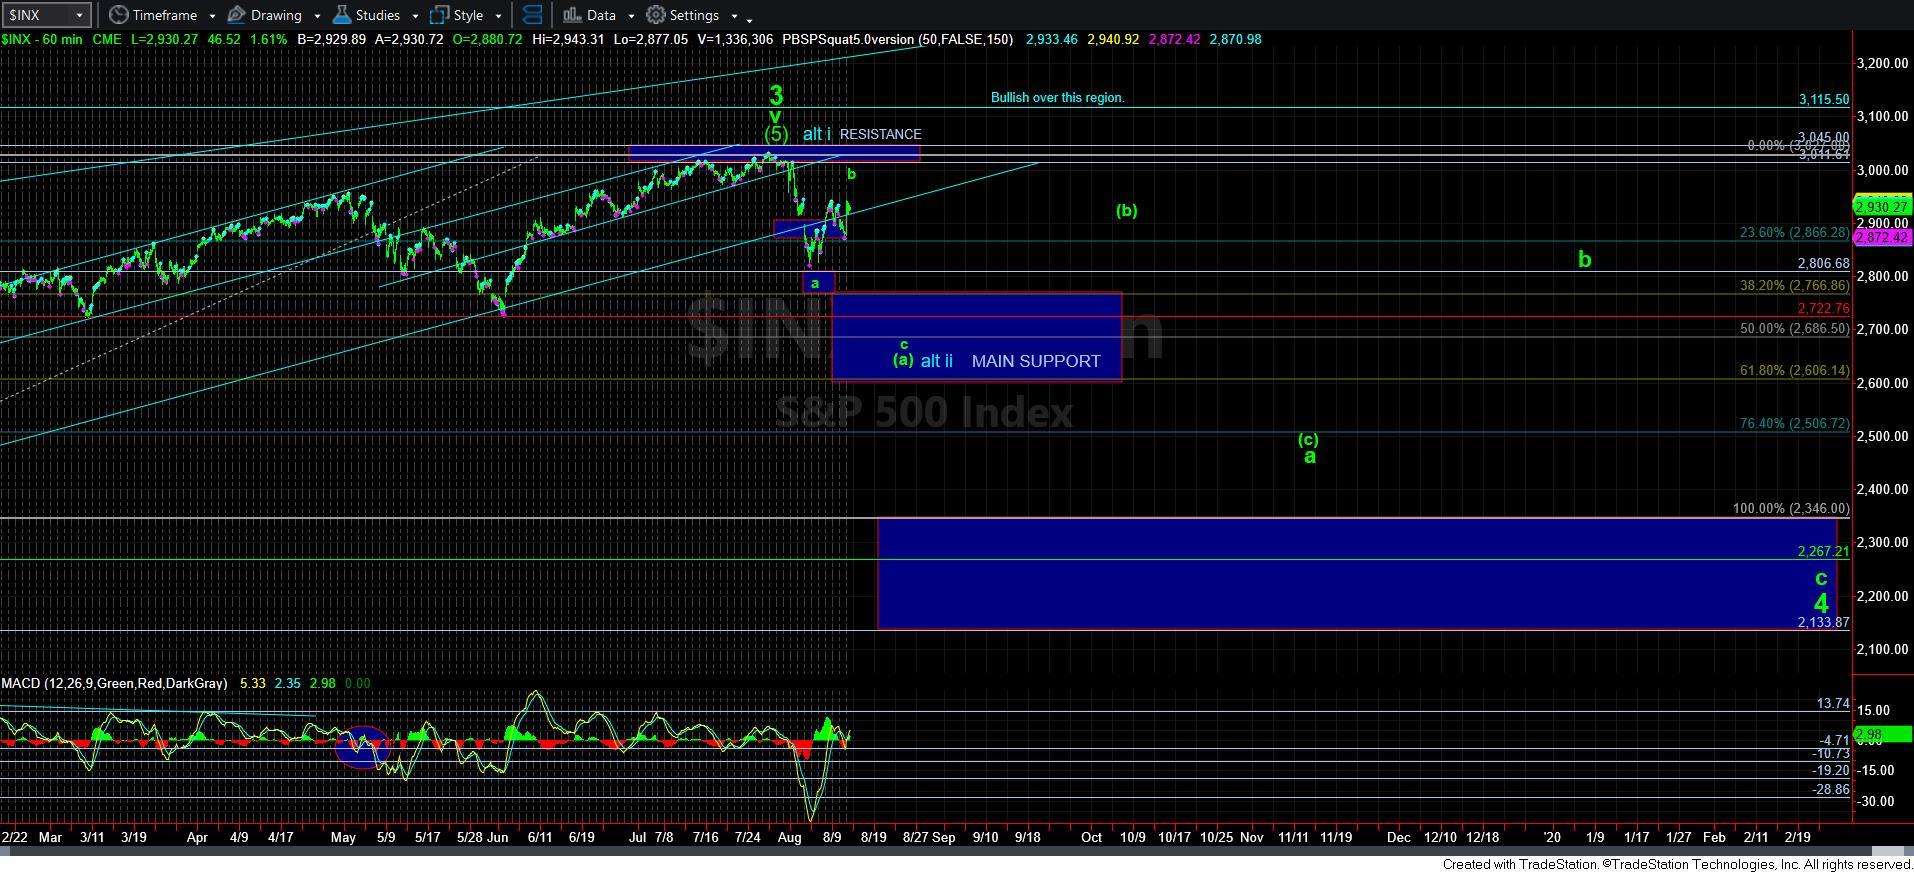
As I mentioned over the weekend, corrective action is very difficult since it is so variable. Until we actually have a clear 5 waves down for wave 1 of the c-wave decline, it is hard to be certain that the b-wave has actually completed. But, at this time, it would seem that we have a fuller a-b-c structure now to this b-wave. And, the only other potential I am seeing at this time is if we morph into a triangle for this b-wave. But, for now, I think it is reasonable to assume we can complete it with a push just a bit higher.
I also want to note that since the initial rally off last week’s low was a 3-wave structure, I really cannot view this as anything other than an a-b-c corrective rally, at least if I am going to abide by the standards to which the markets adhere the great majority of the time. So, from a probabilistic sense, this rally still should be classified as a corrective rally.
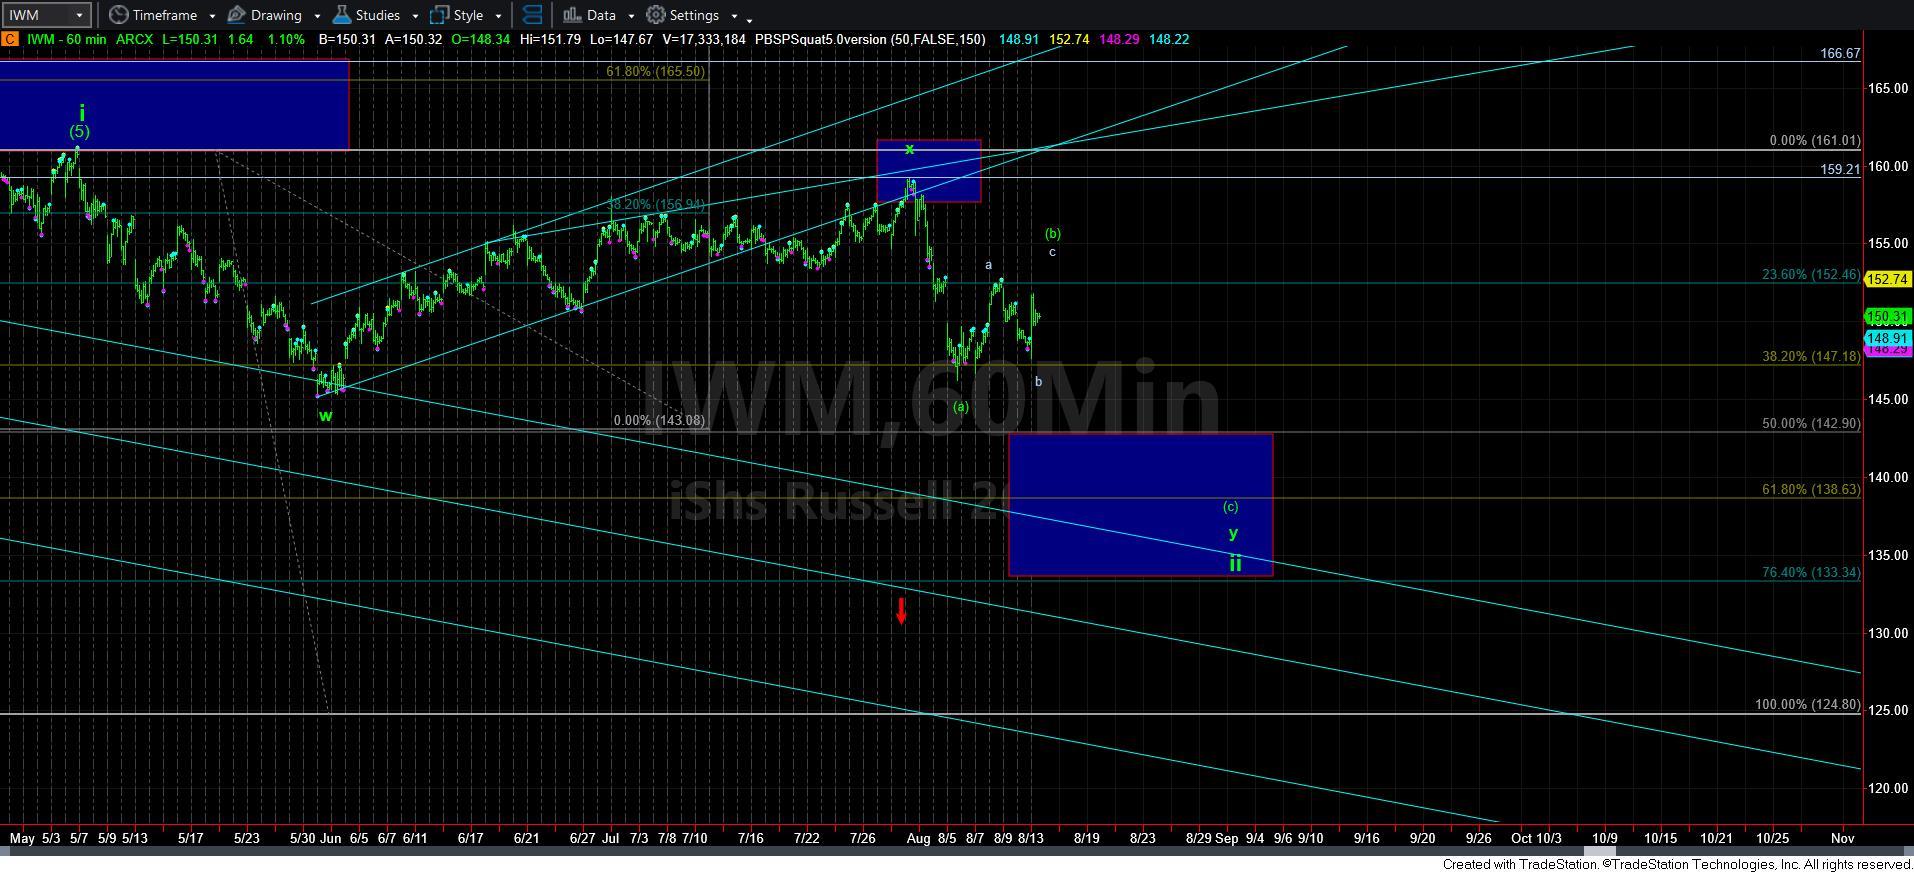
The more interesting point I want to make this afternoon is that the IWM is providing us an outline for a b-wave as well, which means it does not count well for being 5-waves off the recent highs. The fact that it did not complete 5 waves down keeps it aligned with our larger degree bearish expectations in the SPX. However, as I have been tracking the potential for a more immediate bullish count, I now have to default to a more rare w-x-y structure. But, within this potential, I don’t think we will bottom on the next decline at the 143 region, but it would more likely be targeting the 133-138 region.
But, the main point is that I think it is rather clear that this has turned into a corrective rally in IWM as well.
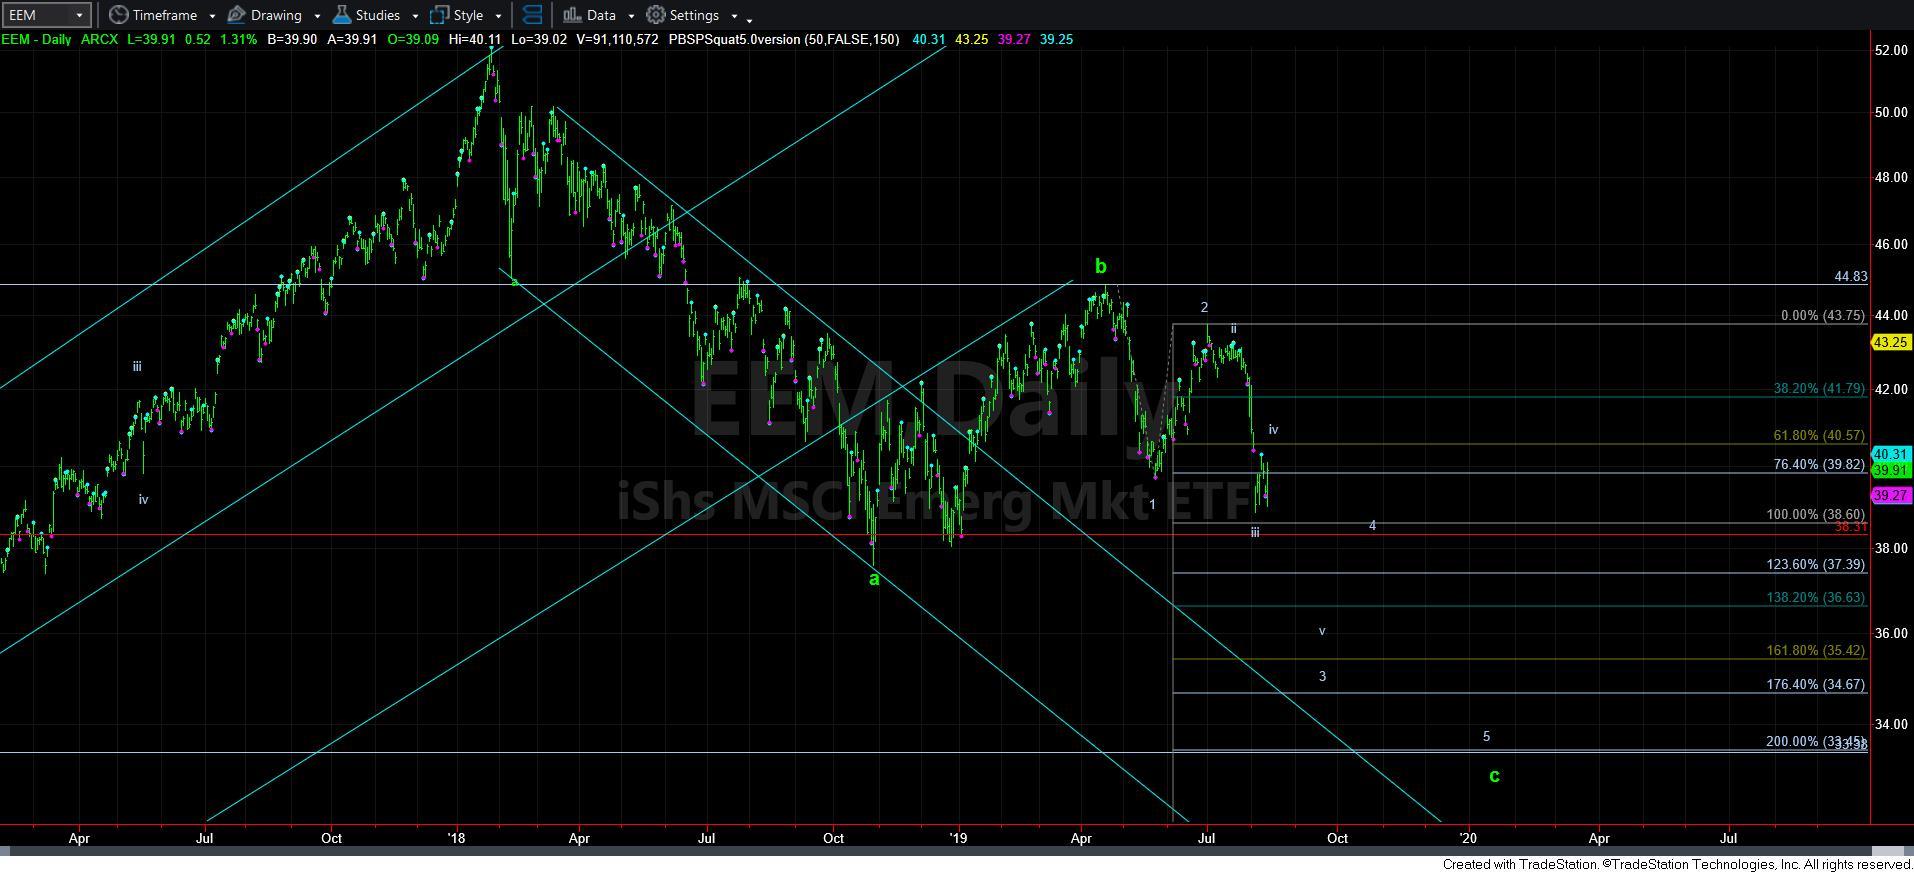
Next I want to highlight something I have not noted for quite some time, and that is the EEM. As you can see from the attached chart, the EEM has been in a larger degree a-b-c structure since it struck its high in early 2018. To be honest, this aligns with the yellow count I had been tracking in the SPX. But, I still cannot say it has a high probability in the SPX. Clearly, it has a much higher probability in the EEM specifically because we seem to be in a 5-wave c-wave decline.
The most important point to note right now is that it too seems to be developing over the last few days as an a-b-c corrective structure. But, the corrective structure in the EEM is as a wave iv within a wave 3 of c. And, as long as this remain below the 40.50-41 region, this should likely resolve lower in the near term. Again, this seems to also be aligned with the potential down we are seeing in the SPX to levels below 2700 in the near term.
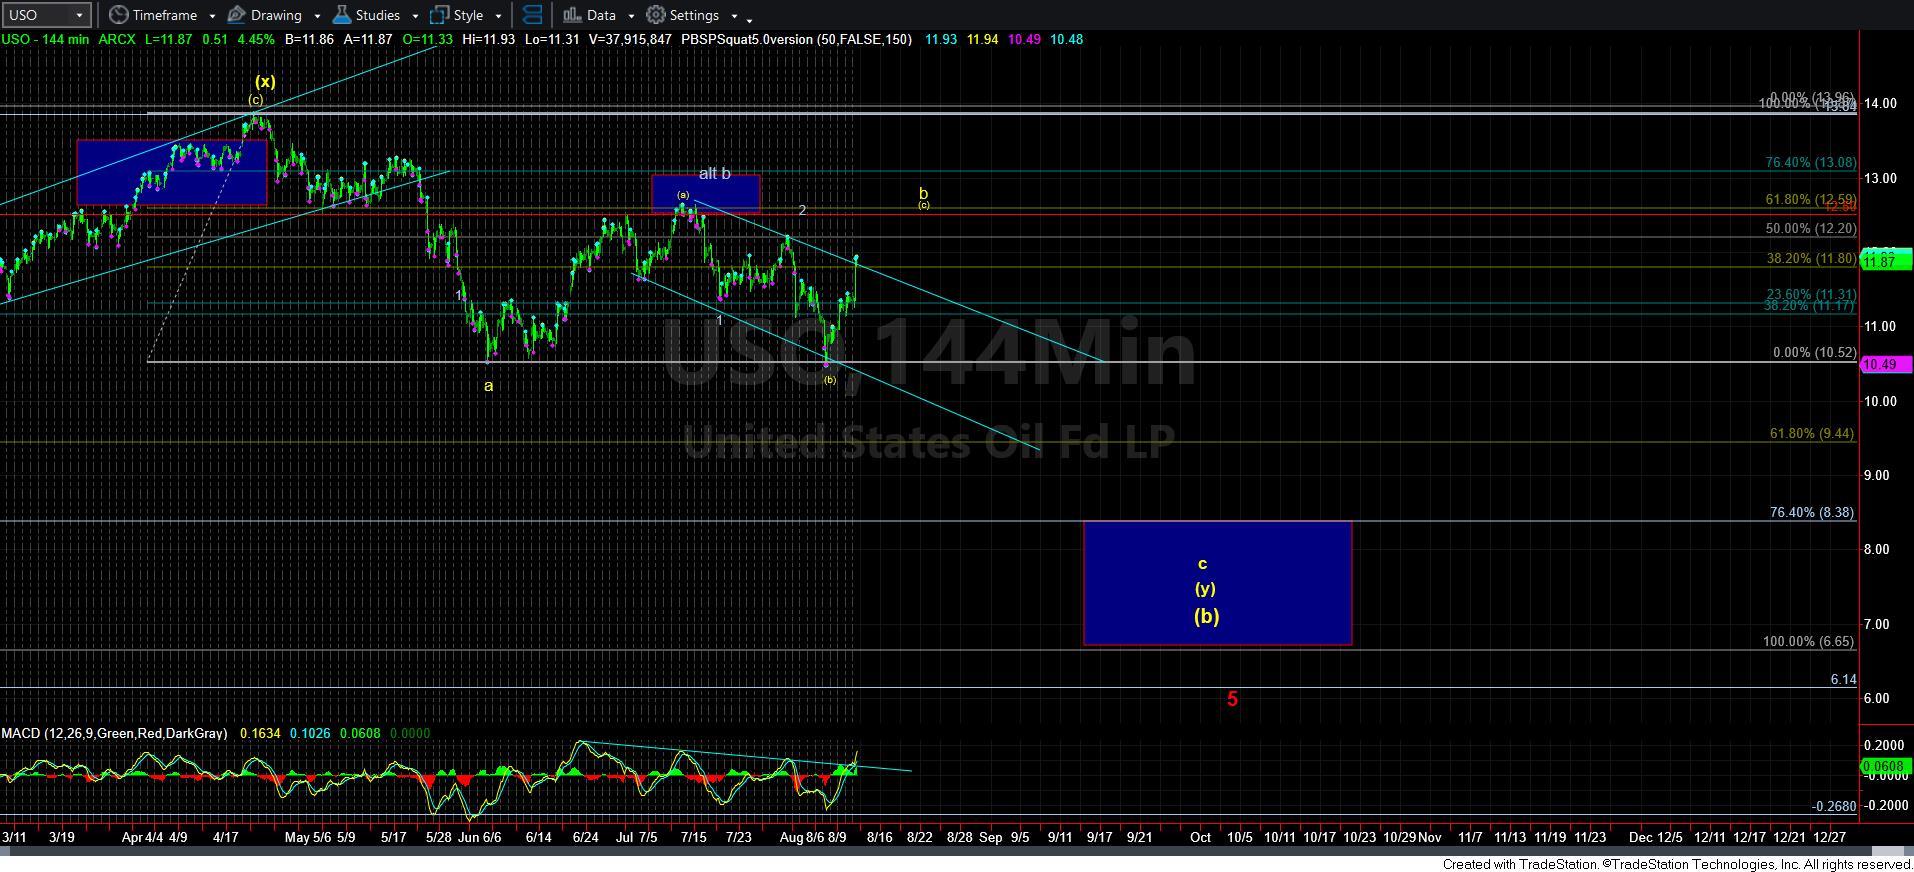
Lastly, this is not something I usually view in alignment with the equity markets, but I have to note the striking similarity of it being in a c-wave of a larger b-wave as well - - and that is USO. While it still seems to need bit more work to the upside to potentially complete it, the alternative count I now have presented on the chart allows for it to continue to much lower levels sooner as well.
The main point I am trying to get across is not only are individual stocks still looking like they are preparing to roll over in the coming weeks, but markets across the spectrum seem to be in alignment with a bearish resolution as well.
So, for now, I still maintain that we are trying to put the finishing touches on what is now a more complex and full b-wave structure, and I believe we will likely resolve to the downside in the coming weeks, pointing to levels below 2700SPX. And, from the looks of the other charts, it would seem the SPX may have some company.

