Big Test For The Bulls
With the market rallying off of Friday’s low (despite many telling me that the market does not bottom on a Friday), we are now approaching a main Fibonacci Pinball test for the SPX/ES.
Let me explain. We use our Fibonacci Pinball structure not just to outline accurate targets in the market, but it is an amazing tool in determining whether a rally is corrective or impulsive. You see, once we have an initial 1-2 off a low, the market will then rally towards the 1.00 extension of that 1-2 structure. In a bullish impulsive structure, it will pullback correctively and hold the .618-.764 extension of waves 1-2 (which is what I outline as the “pivot”). However, if the rally is corrective in nature, then it will break back down below the pivot in impulsive fashion, and head lower for a c-wave in an a-b-c pullback.
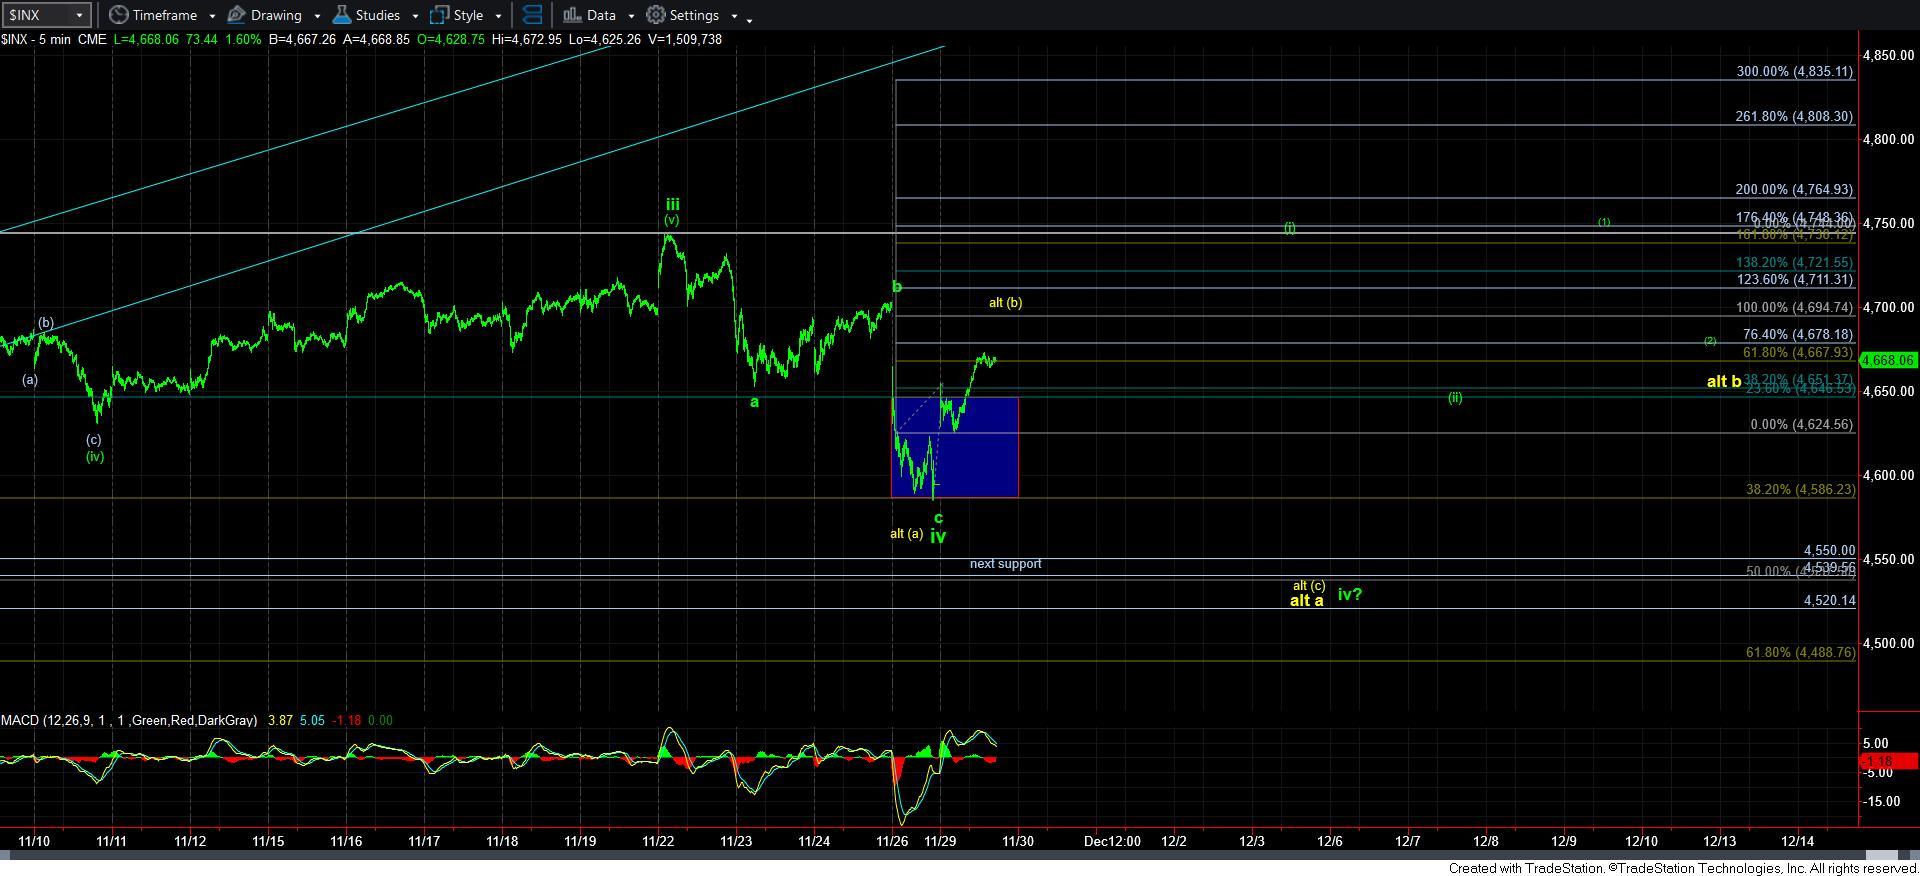
I now have this potential outlined on the 5-minute charts, and I would focus on the 5-minute ES chart for the next paragraph, with the paragraph thereafter more easily seen on the 5-minute SPX chart...
So, let me take you through it step by step. Assuming the market breaks out of the pivot directly to the 1.00 extension on the ES chart, then this would represent wave 3 of [3] of wave [i], or it can represent a [b] wave. If the market pulls back correctively from that 1.00 extension and holds the pivot, we can then continue on our way in the impulsive count to the wave 5 of [3] region.
However, if the market breaks down below the pivot in impulsive fashion, then we are likely going to see a [c] wave decline towards the 4530-50SPX region. But, please do recognize that even if we do get a [c] wave down, it still could be a bigger wave iv pullback in green, as shown on the 5-minute SPX chart. But, there is no question that if we break down again from here in a [c] wave, the probabilities for the yellow count begin to rise.
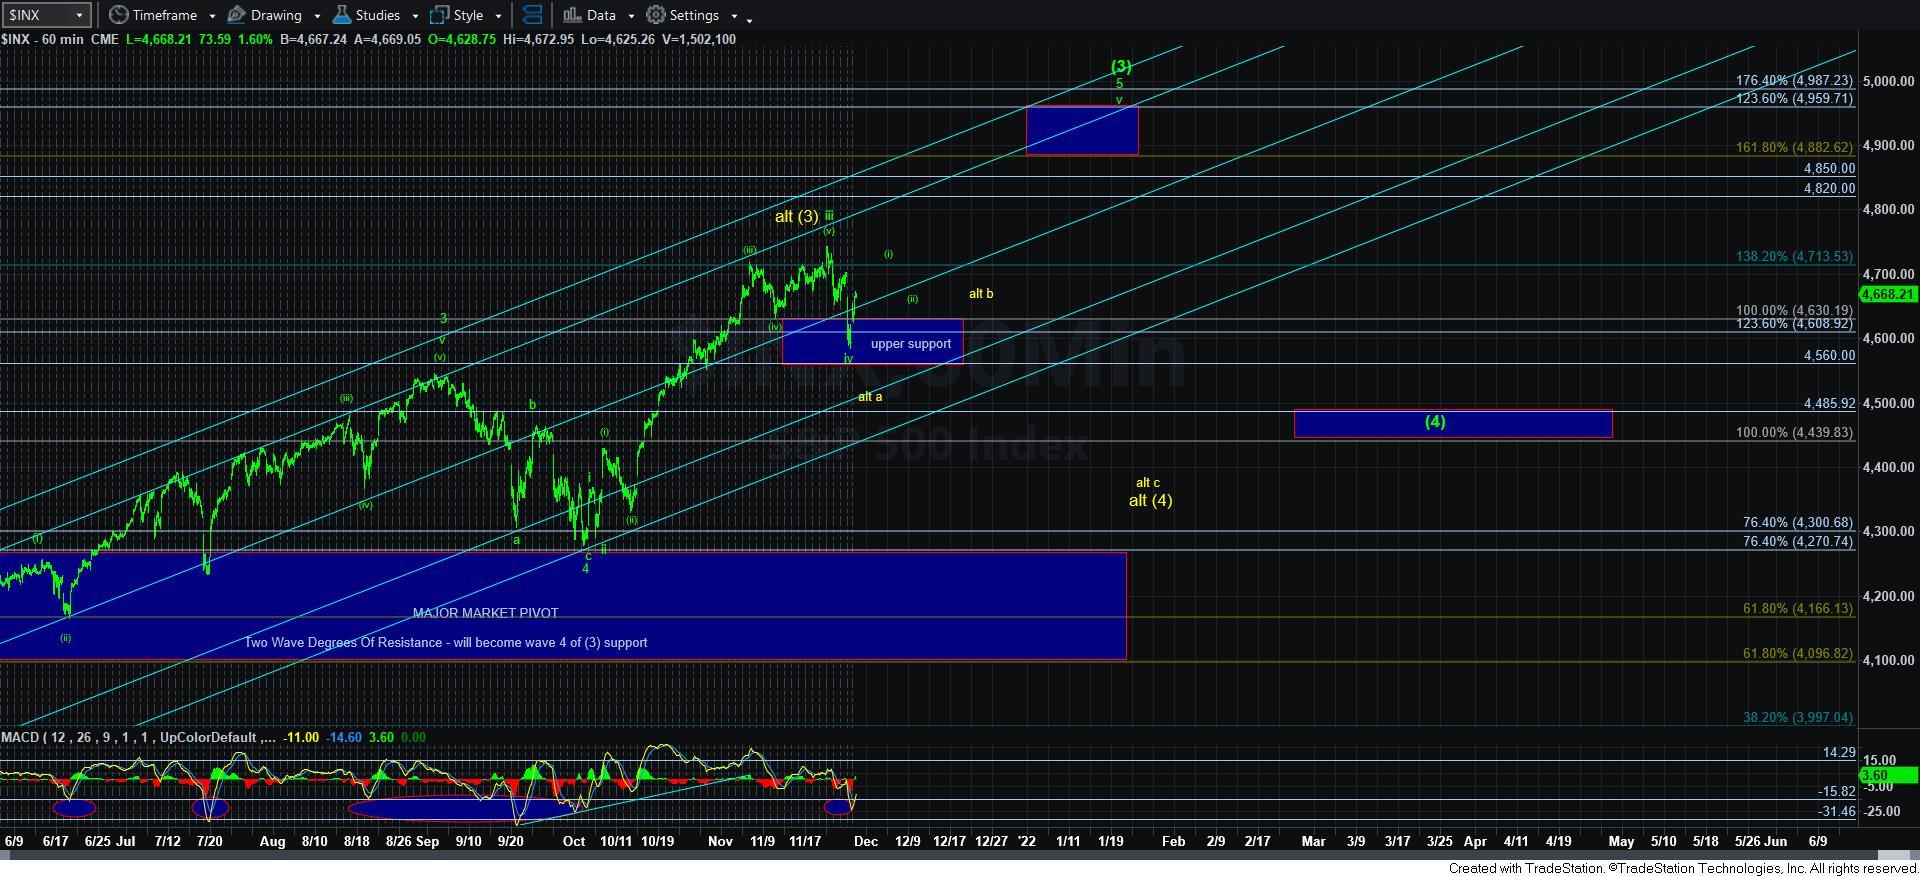
For those who are more conservative amongst us in their positioning, let me make a suggestion. I have outlined a set up that will point us to the 4960SPX region to complete wave 5 of [3] on the 5-minute SPX chart. You see, the current [1][2] structure in this micro move off the lows is actually projecting back to the highs if we are going to complete a full 5 wave rally to complete wave [i] of 5 of [3]. That would then provide us with a wave [ii] pullback thereafter. But, the target for that wave [ii] would be rather large so the amount at risk in buying that wave [ii] would have to be considered, as the stop out point is where wave [i] began. This means that the risk could be as high as 50-70 points.
However, if you allowed the market to complete a wave [ii] pullback, and then fill in the next wave degree in waves [1][2] of wave [iii], you can then buy a wave [2] pullback, with your stop being wherever wave [ii] bottomed, which can likely cut your risk in half. Remember, this set up is projecting to the 4960SPX region, so it may be best to allow it to develop before you get aggressive on the long side. Again, this is just a risk management idea.
In the meantime, we have a set up for the market to climb back towards the prior all-time high, which will set up a rally to 4960SPX. But, clearly, we need to complete this larger degree initial 5 wave move off Friday’s low to make this a much higher probability.