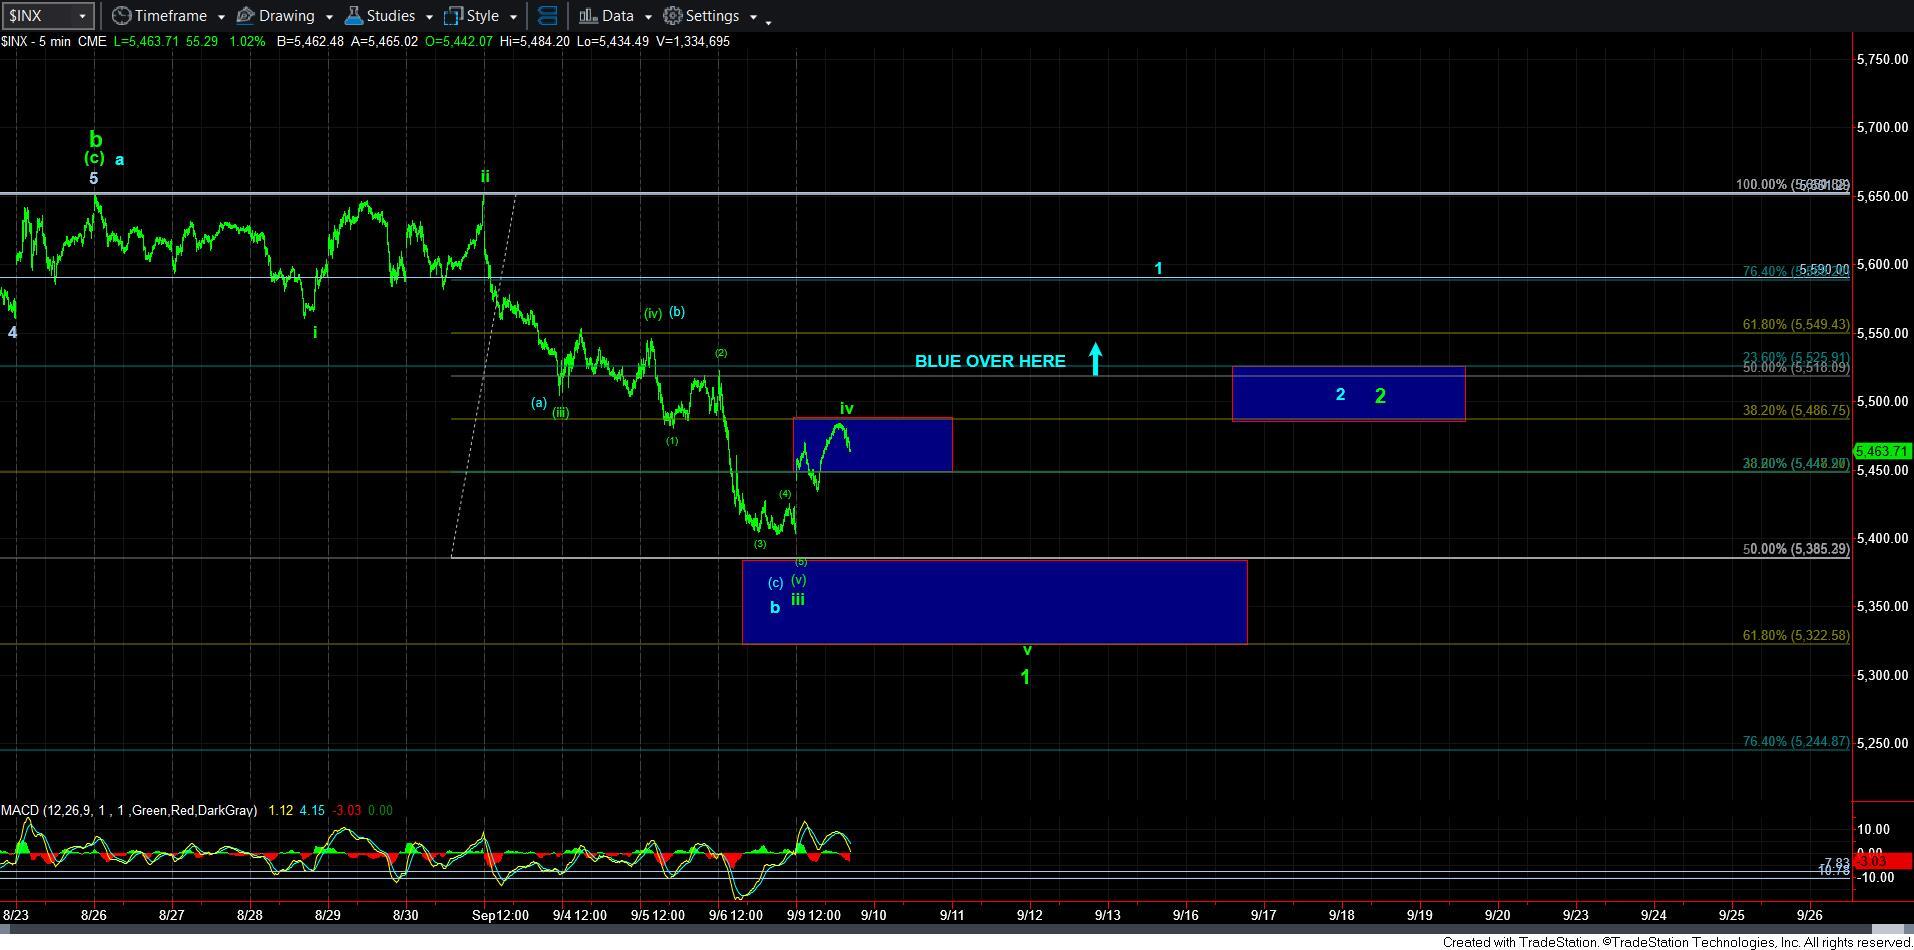
Big Test - Market Analysis for Sep 9th, 2024
As per the weekend analysis, this rally was to be expected. And, while it was quite strong thus far, it has still held the resistance noted on the 5-minute SPX chart.
So, it keeps our analysis quite simple and short. As long as the market respects this resistance region, we can still view this as a wave iv, as presented. We still need to make a lower low for wave v to provide us with a reasonable 5-wave decline structure.
However, should the market take out resistance, then we move into somewhat of a no-man’s land between the .382 and .500 retracement region. This can still be a wave iv, albeit a larger than the standard one. Yet, if the rally continues through the .500 retracement, then the probabilities begin to shift towards the blue wave count.


