Behold, A Pullback - Market Analysis for Feb 16th, 2017
Yes, ladies and gentleman, the market has provided us with a pullback. How long will it last? Well, an IDEAL wave (4) may last into tomorrow.
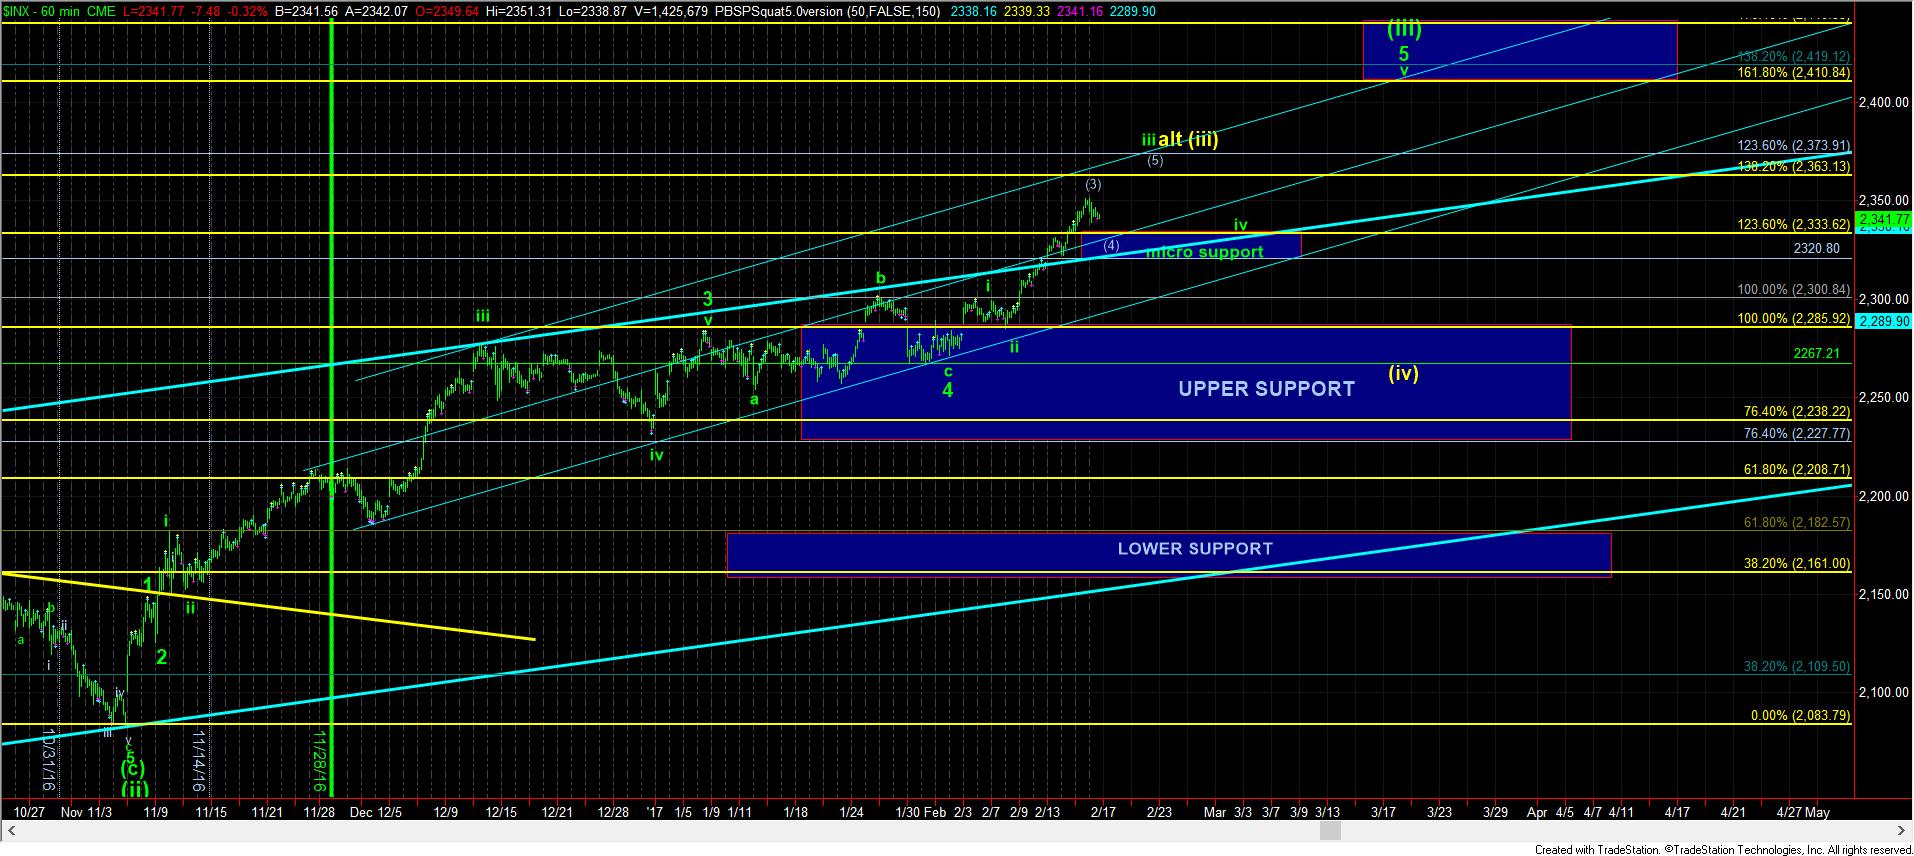
But, as we know, the market has been quite stingy with pullbacks of late, and with the break of micro support this morning, it suggests that we can see a test of our micro support region. Based upon the structure of this current consolidation, it does look like the market wants to test the 2333SPX region, and it is much less likely we will break down below 2320SPX YET.
Based upon where I believe we are within the structure, it suggests that we are in wave (3) of iii, in the most bullish sense of the pattern. As long as we hold our micro support region, I am expecting at least one more rally for wave (5) of iii, but, alternatively, it could complete all of wave (iii). The only way we will be able to view the market as being in wave (iv) with a high probability is either by completing all of the green count into the middle of March, or by breaking down below 2320SPX before then. For this reason, I had suggested that you may consider de-risking your short term holdings, until we are well within wave (iv), at which time you can look to get long again for another larger rally towards the summer.
For now, as long as we hold 2330SPX, I maintain a strong immediate bullish bias with a target in the 2370SPX region next. From that point, I become a bit more uneasy with trading the long side, as I am less certain about us being able to attain that 2400 target just yet. And, again, a break down below 2320SPX would open the door to us being in wave (iv).