Behold – A Bearish Set Up
Now, before you go out to mortgage your house to short the crap out of the market, allow me to present to you the set up for you to make your own determination.
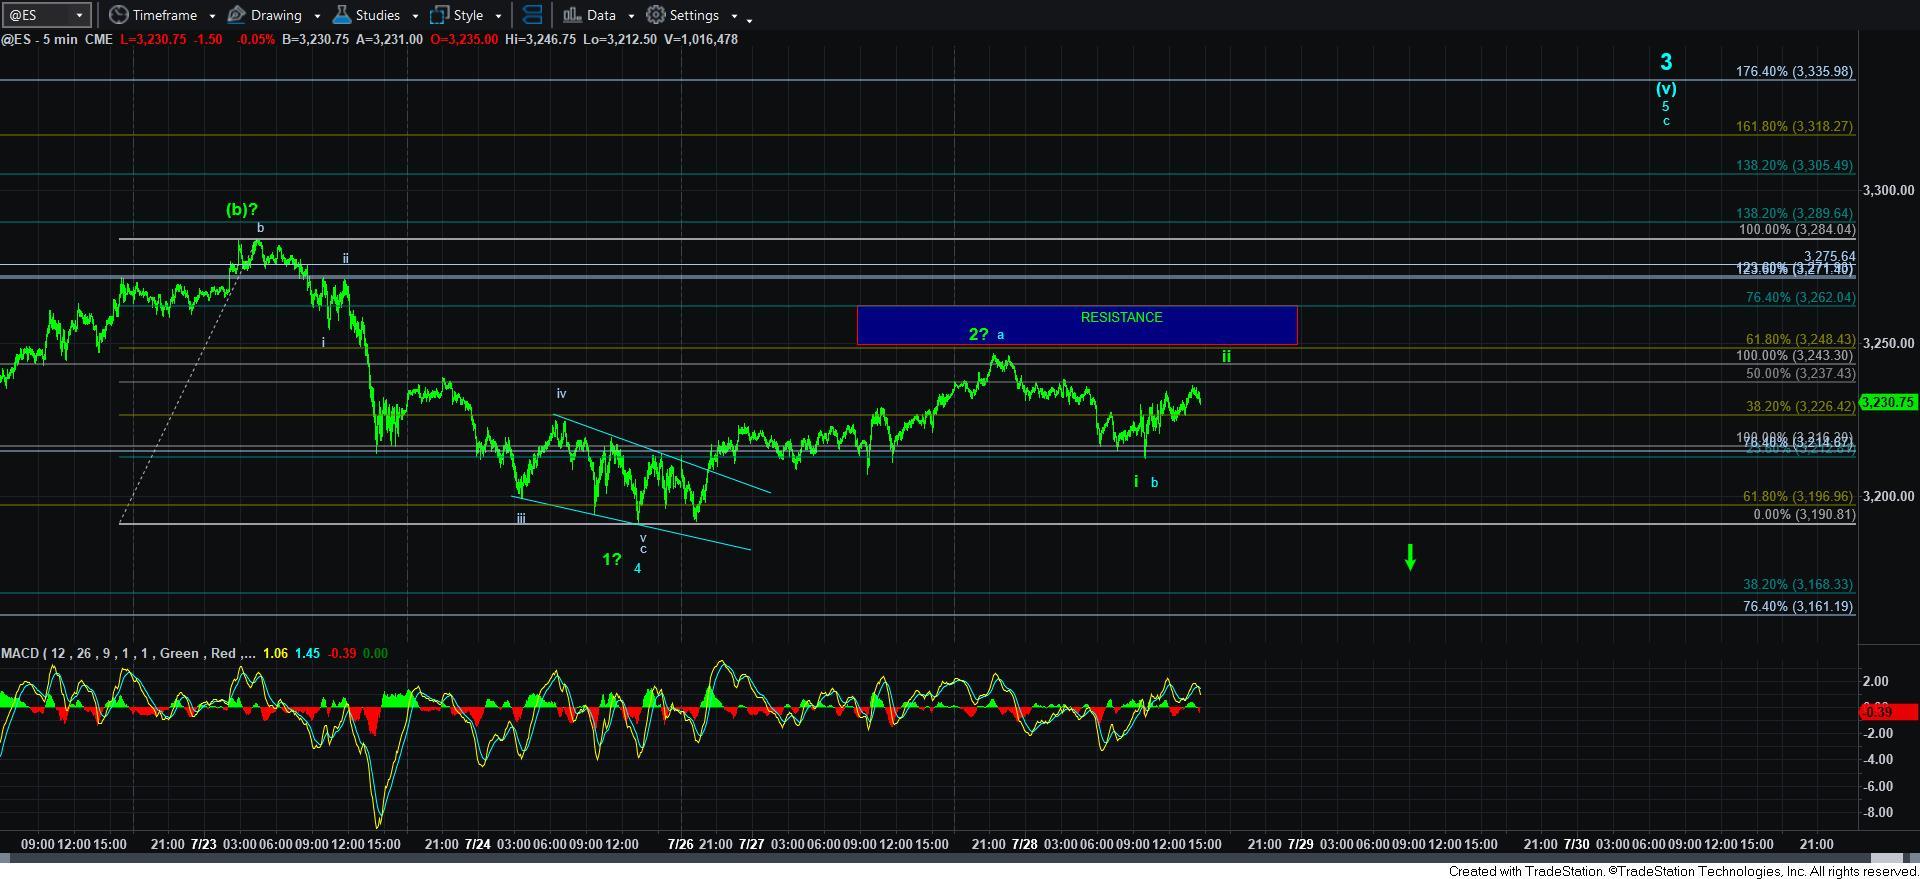
First, this set up is a possible 1-2, i-ii downside set up which is ONLY evident in the ES futures chart. Second, we have seen these types of set ups invalidate all the time, especially when we did not have a matching pattern in the SPX cash index.
Yet, I still have to at least highlight the potential. As you can see from the attached ES chart, we have a potential 1-2 downside set up, followed by a VERY amorphous looking i-ii downside structure. And, if you cannot guess by my description, I do not see this as a very clean set up in the second i-ii structure. But, I have to at least point it out.
So, it would seem that the market may use the Fed as the excuse . . er . . I mean the catalyst for pushing the market one way or the other in this set up.
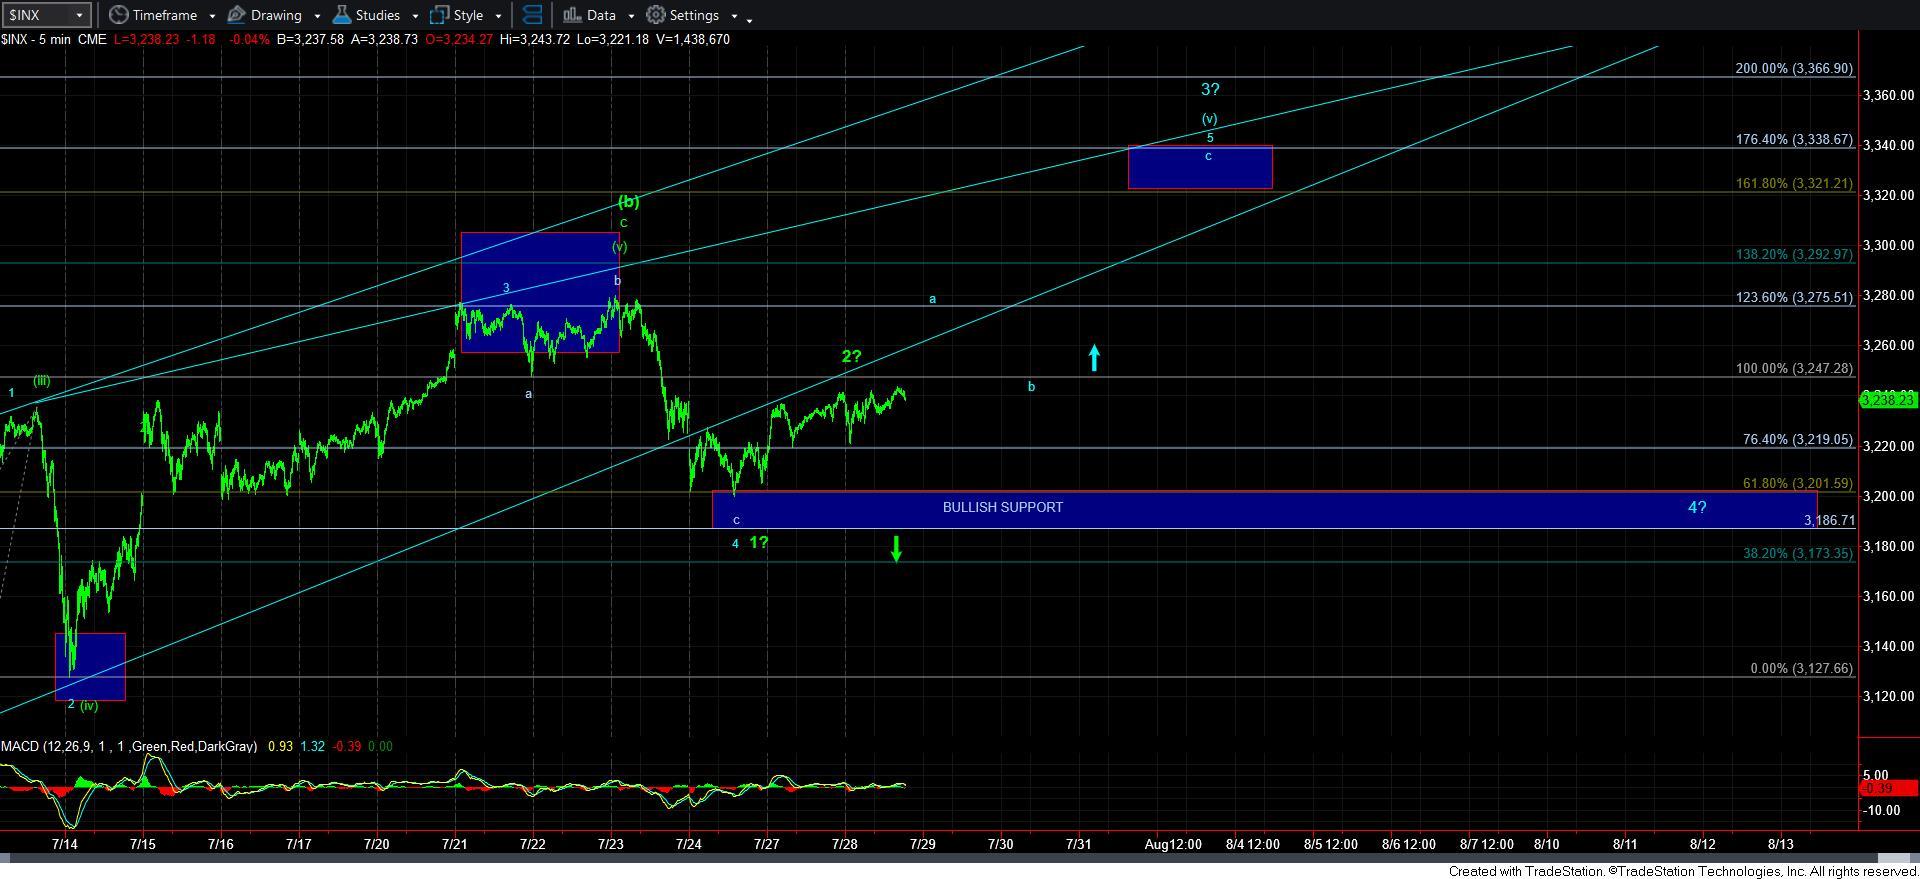
As we know, should we break down below 3185SPX, then we have our initial indication of the [c] wave decline towards the 2900SPX region. And, following through below 3115SPX would confirm that potential.
However, for as long as the market holds over Friday’s low, we have the potential to squeeze up higher towards the 3320-40SPX region to complete the 5th wave of an ending diagonal for wave [v] of 3 in blue.
But, keep in mind that even if we do get that 5th wave higher in the diagonal, it will likely reverse strongly from that target region back down towards the 3185SPX region for wave 4. . . if not a green [c] wave back to 2900SPX. So, as I noted in prior updates, the question is if you can keep your FOMO in check should we go higher. But, for most investors, it is not really worth the risk to attempt to trade for a potential 5th wave to compete a diagonal.
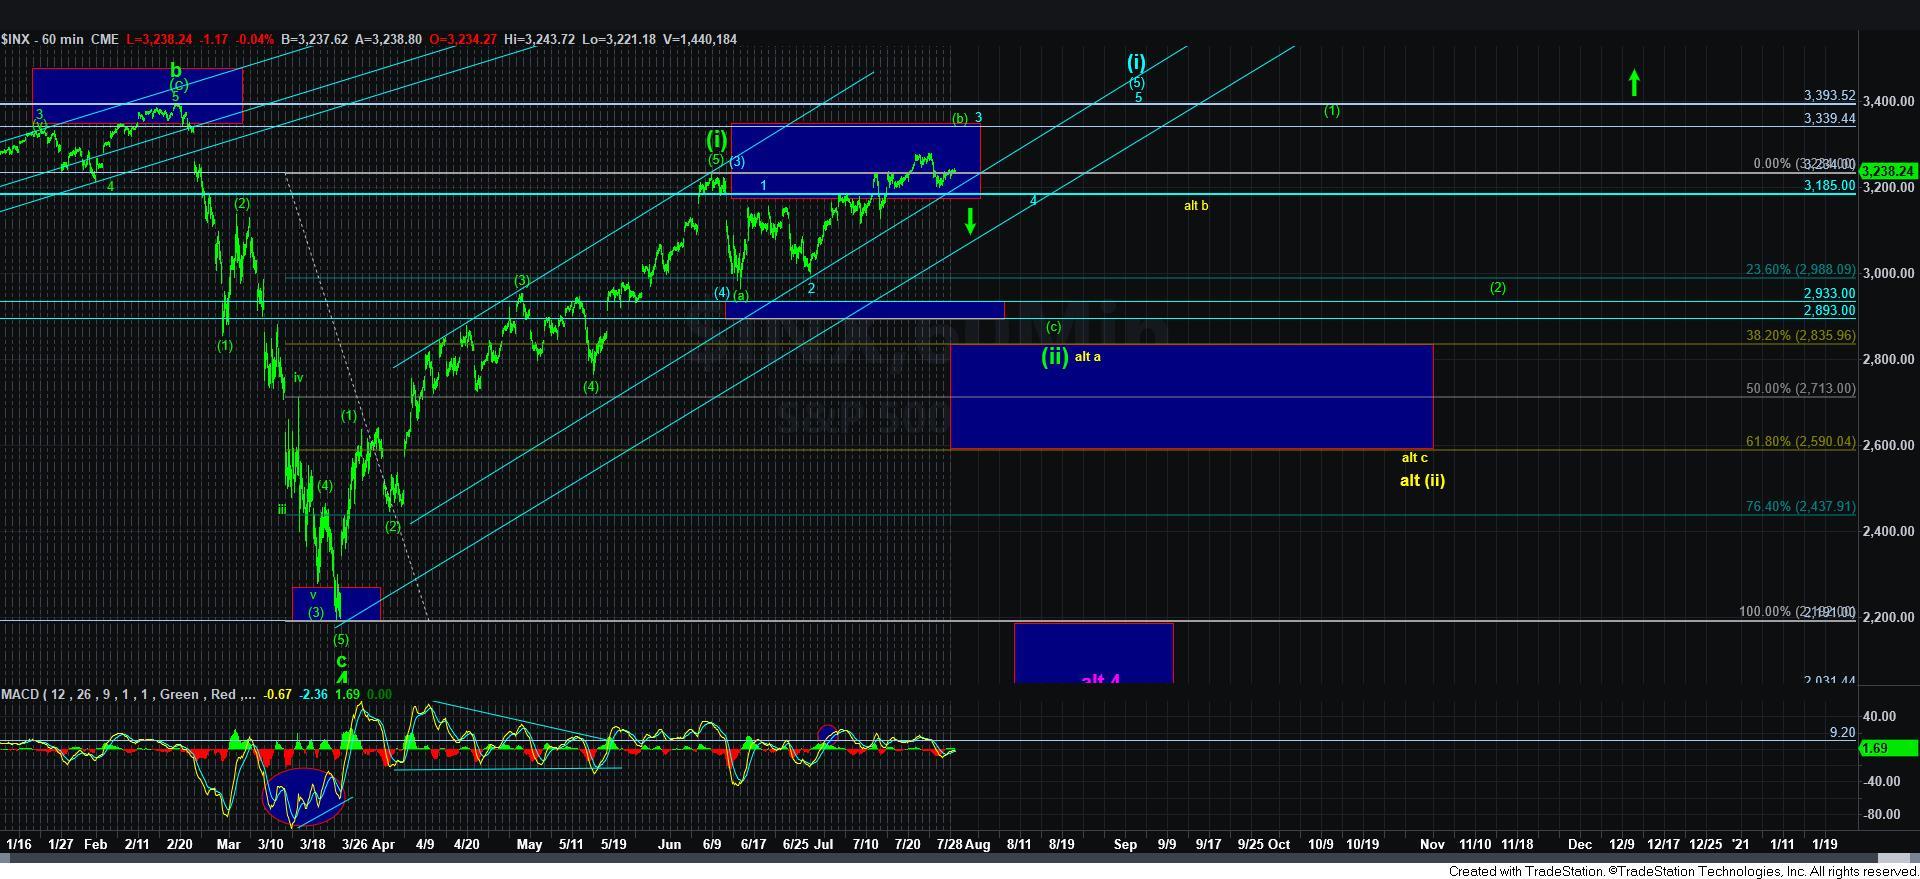
But, our bigger perspective still remains the same. Over 3185SPX, and I can retain a bullish bias just to complete the blue wave [5] of [i] off the March lows. However, should we see a break down below 3185SPX, we have an initial indication that a green [b] wave has topped, with a follow through below 3115SPX pointing us down towards the 2900SPX region in a green [c] wave of wave [ii].