Bears Last Stand Before 2500SPX
With the market continuing to melt up, it has potentially presented us several things that have happened outside of standard wave structure. I will discuss that further below.
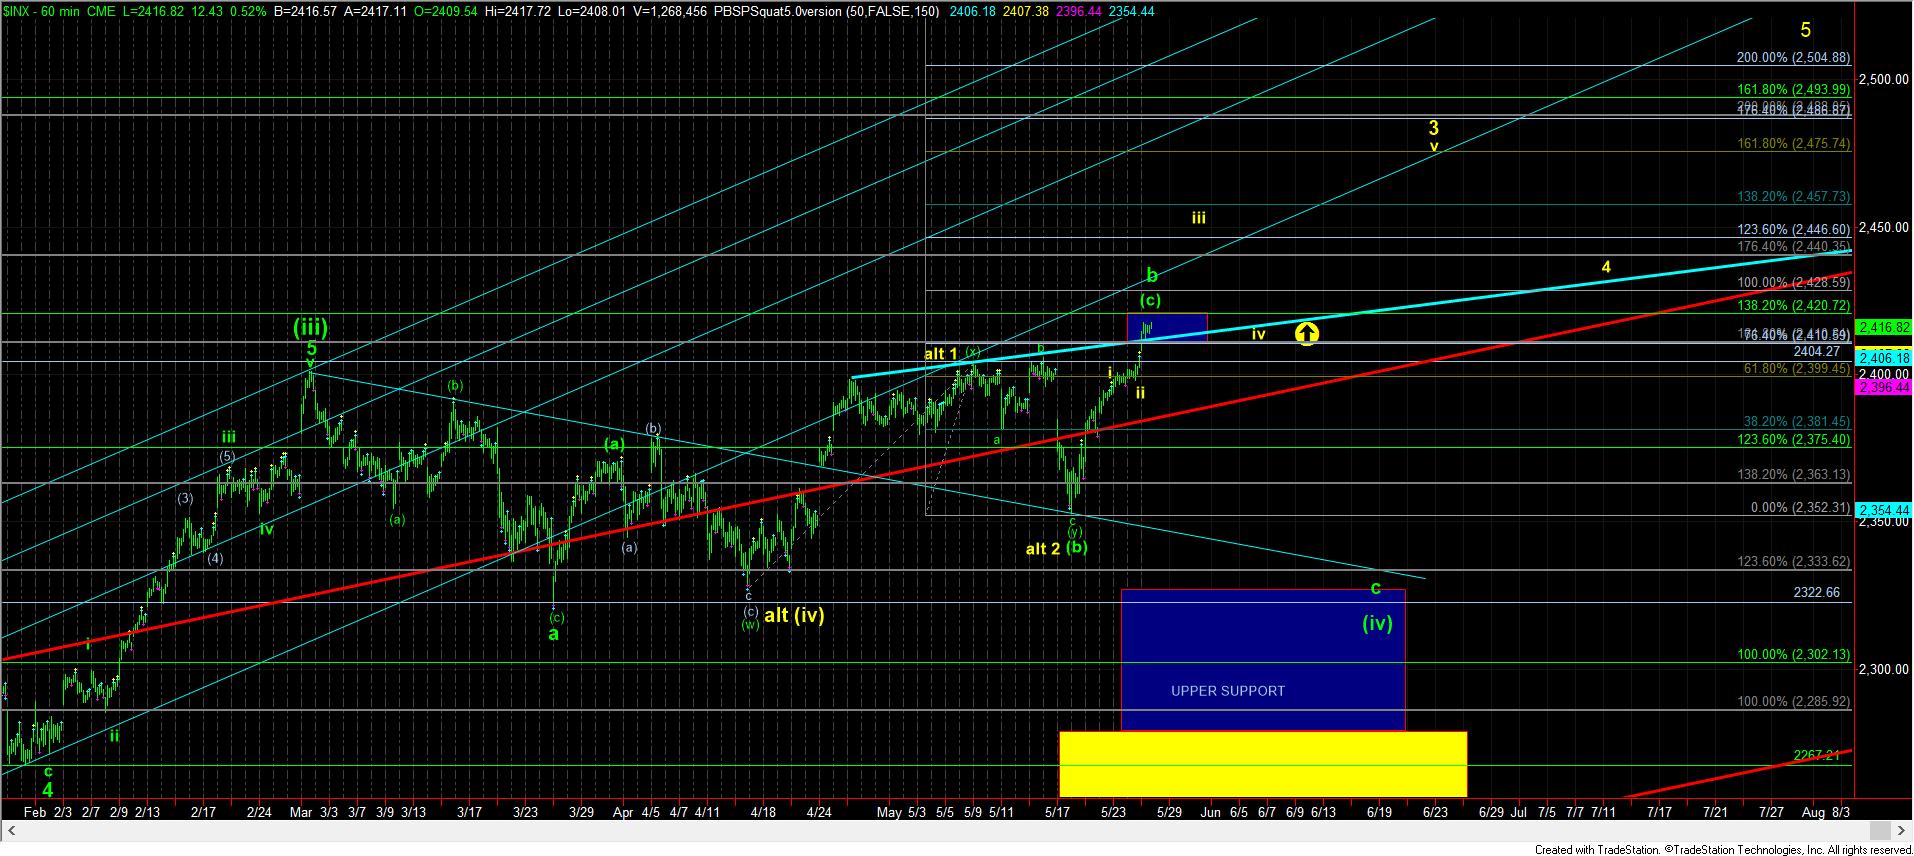
But, for now, the market is in the middle of our resistance box to which we have been pointing for months. This was the ideal region for the b-wave rally to top, and we now find ourselves within that region, which resided between 2410-2425SPX. But, until we see the market break back down below 2400SPX, we have no signal that a b-wave has topped.
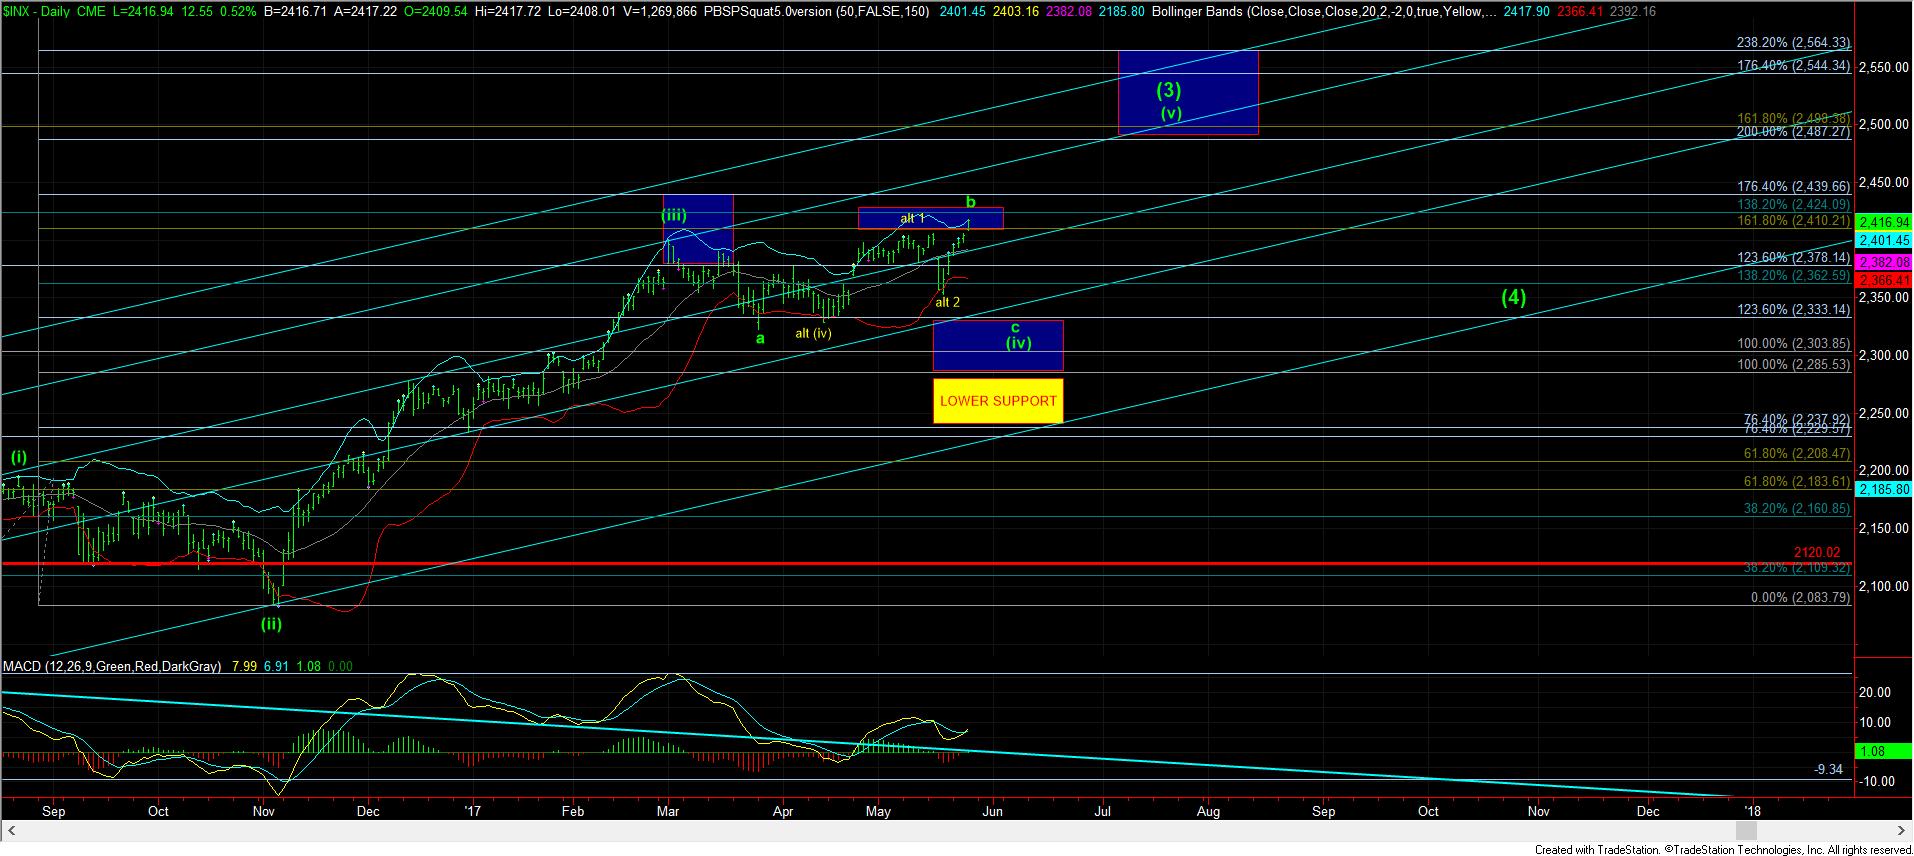
This leads me to mention – at least for academic purposes - those patterns which have occurred out of the norm if we are indeed already heading to 2500SPX. First, yellow wave (iv) would have bottomed at the .236 retracement of wave (iii), whereas the standard retracement resides in the .382 region (2285SPX). Second, the c-wave of what we would have to consider wave (iv) was not a standard impulsive 5 wave structure. Third, if we are already in the heart of wave iii of 3 in the yellow count, as you can see, the wave ii was almost non-existent.
So, the question the market is now going to answer within the next few trading days is if all these lesser likely events will add up to take us to 2500SPX sooner rather than later, or will we see a standard c-wave down to complete a larger wave (iv) per our normative standards. Clearly, I cannot answer this question, nor could I have foreseen that so many non-standard structures would coincide to take us to 2500SPX sooner than I had expected.
So, for now, I have to respect the resistance region we are now within, which clearly can turn us back down below 2400SPX in a c-wave down. However, if the market is able to continue to melt up through this region, and surpass the 2428SPX region, then it suggests we are in the heart of wave iii of 3 in yellow, and will likely come back into this region to re-test this break out region from above in wave iv. At that point, you may chose to add to long positions to trade up towards the 2500SPX which will likely be completed by the middle of the summer in this structure.
However, if we see the market break down below the 2400SPX region before we continue to melt up through 2428SPX, then I will be looking for that c-wave down to complete wave (iv), as presented in green.
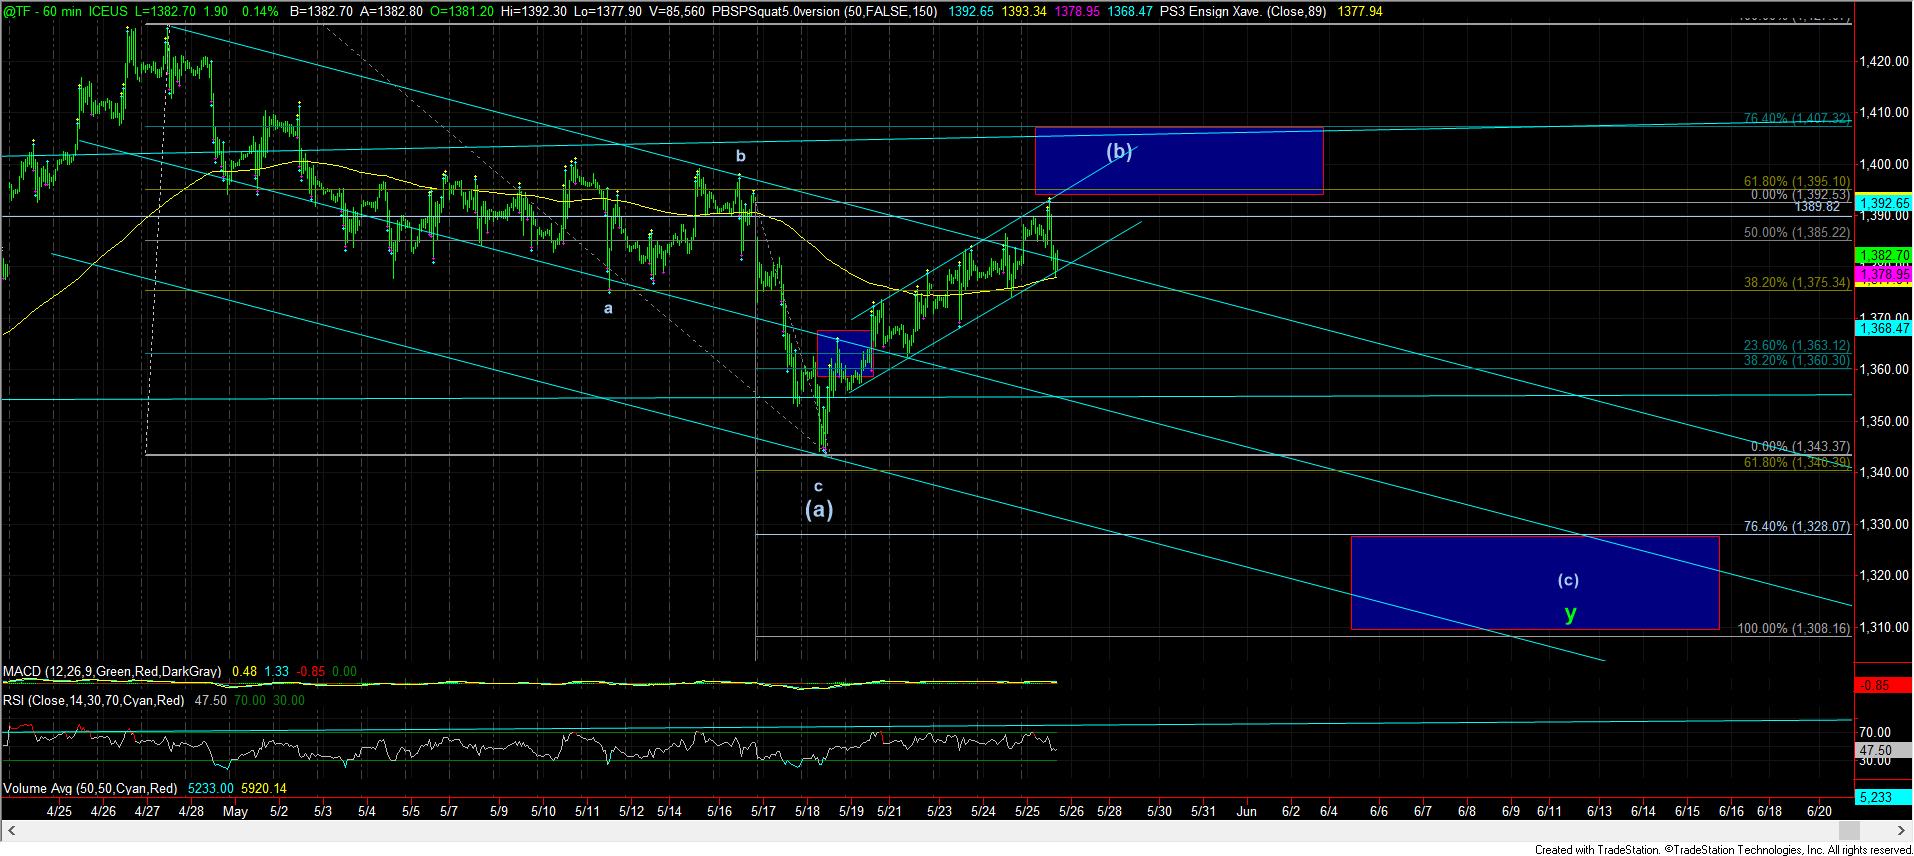
But, the one thing that is still keeping me as viewing the strong potential for topping in the b-wave in this region is the action seen in the TF/IWM, which still suggests lower lows can be seen in wave (iv), as long as we do not break out over the resistance box noted on the chart.