Bearish Set Up Still Retained
Yea, I know. We just went through this last night. And, as I warned in my updates at the end of the day, unless the market was going to be able to break below 3200ES in the overnight session, it was setting up for another bullish reversal back to the resistance box on the 5-minute ES chart. Lo and behold, that is where we are right now.
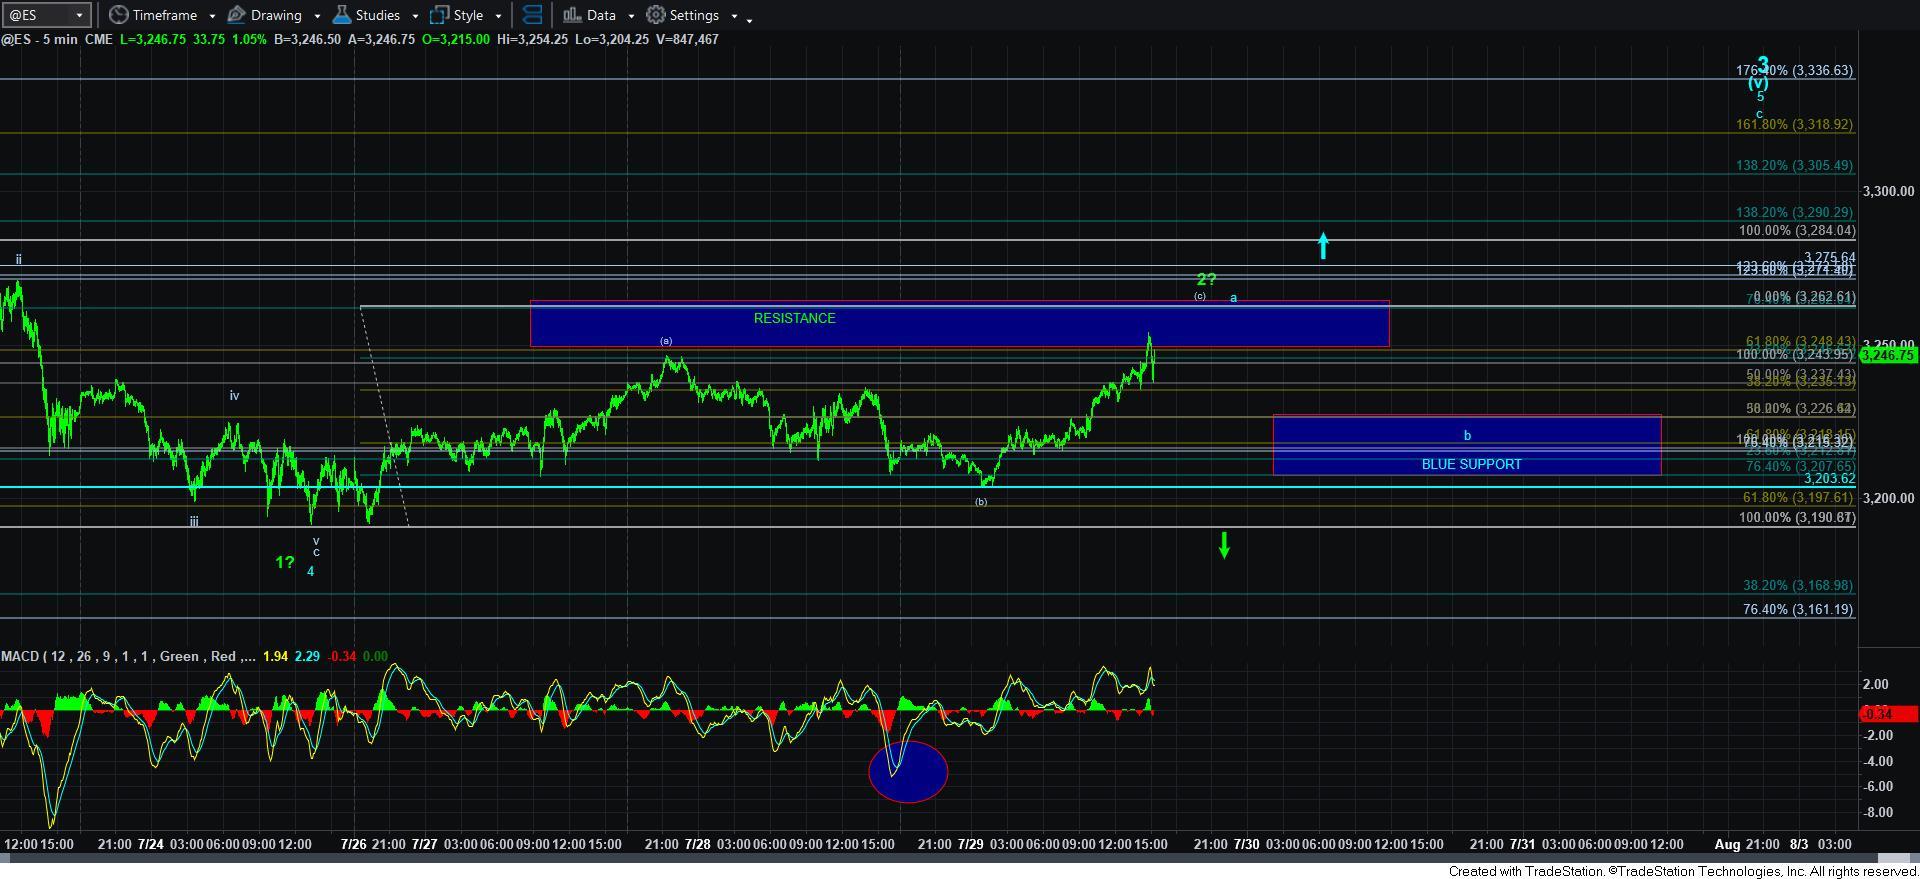
At this point in time, as long as the market remains below the 3262ES resistance, the market may have just traced out a larger [a][b][c] wave 2, as shown in green on my 5-minute ES chart.
However, along with the highlight of this bearishly concerning set up, I have to provide you with the warnings as I did last night. I cannot take this set up seriously until the ES breaks below 3200ES. So, for any of you that are just itching to put those bear suits on, please give it another 40 points lower before you get too bearishly excited.
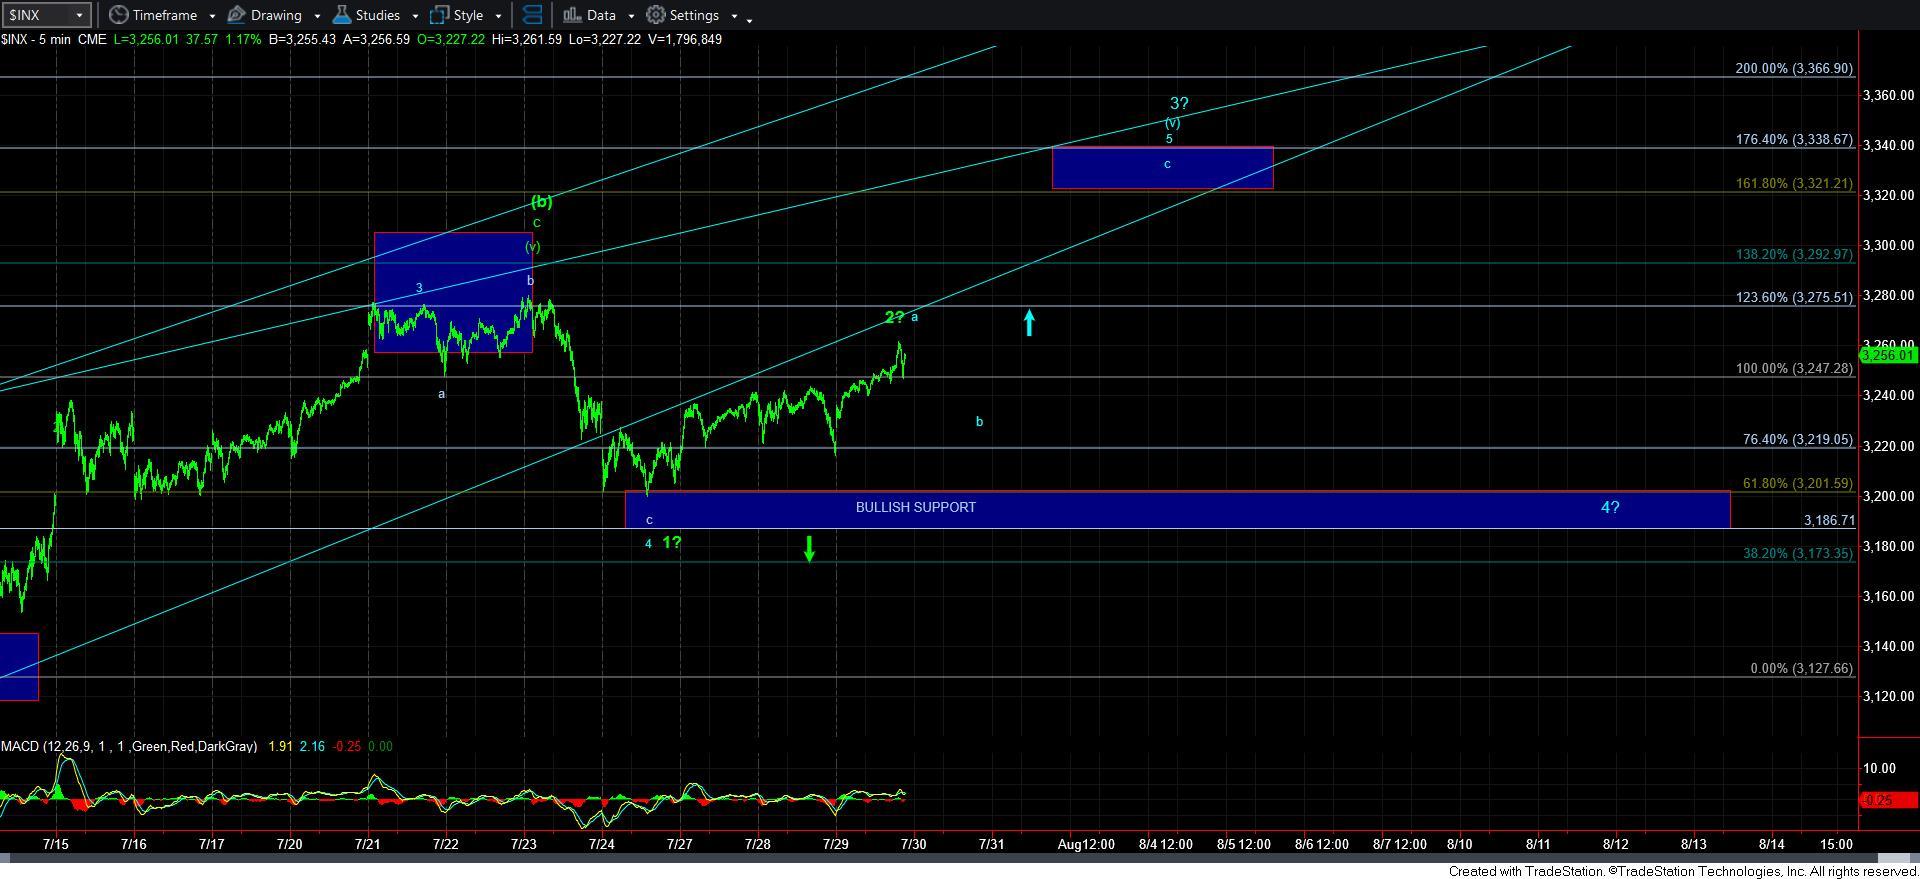
As you can see from the ES chart, the pullback off resistance can also be reasonably viewed as the b-wave in the blue count, pointing up to the 3320-40 region in the c-wave of wave 5 of [v] to complete the ending diagonal potential pattern we have been tracking. Moreover, if the bulls wants to really drive hard, we may even be able to count the rally off the overnight low as a series of 1’s and 2’s, with a strong break out over 3265ES pointing us in a more direct fashion towards the 3320-40 region sooner rather than later.
Now, as I noted last night, trying to trade for a final wave in an ending diagonal comes with significantly higher risks. And, this structure presents risks no differently. While getting back over 3275ES would make it much more likely we are heading to 3320-40 and reduce the risk of an IMMEDIATE reversal in the green count, I want to also remind you that I still think that we see a strong reversal should we complete this wave 5 of [v] in the ending diagonal, and it points us back down to at least the 3185SPX region.
So, I want to repeat something I posted in the chat room today:
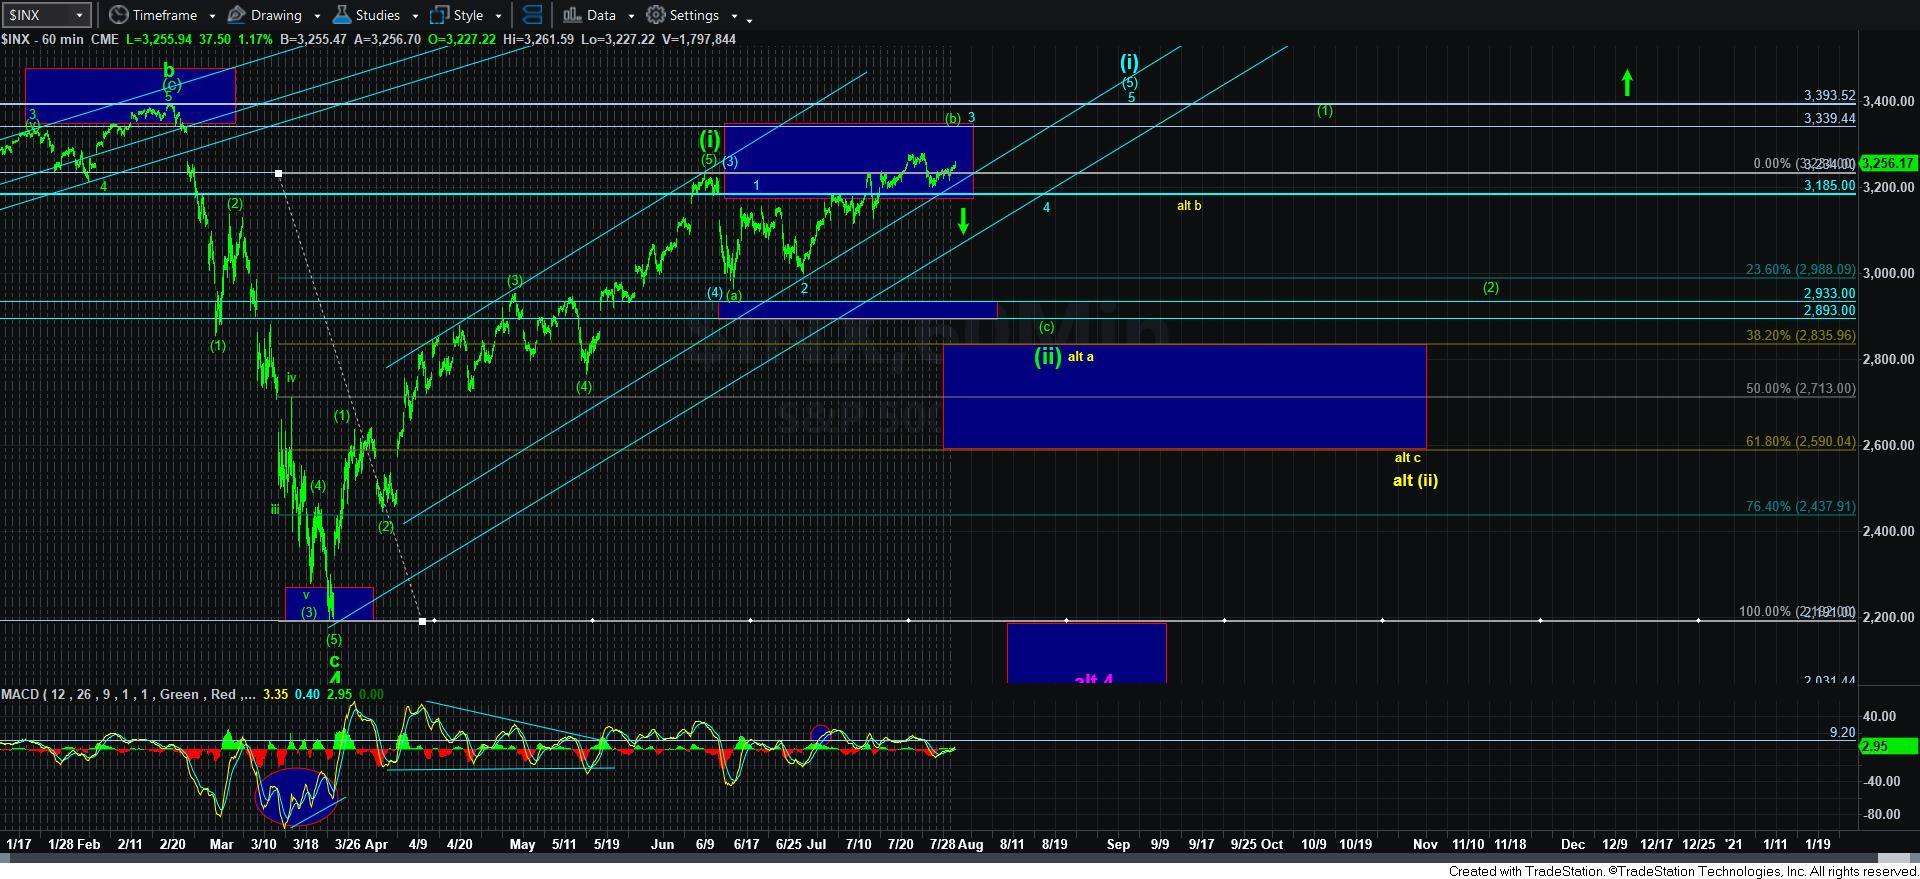
“DO NOT GET COMPLACENT OR BORED HERE FOLKS. THE POTENTIAL FOR TOPPING IN THE GREEN [b] WAVE IS STILL VERY REAL, AND IF WE DO BREAK SUPPORT, IT CAN BE A CRASH-LIKE EVENT IN THE [c] WAVE DOWN.
MOREOVER, EVEN IF WE RALLY STRONGLY TO 3320-3340, WE WILL LIKELY SEE A STRONGER DECLINE BACK DOWN TO 3185.
THIS MARKET WILL PROVIDE SOME BIG SWINGS IN THE COMING WEEKS. STAY ALERT . . . DO NOT LET THIS LULL YOU TO SLEEP. TRUST ME ON THIS.”
So, as the market has continued to whipsaw market participants in this region, and while we certainly warned you about this type of environment based upon the structures we were tracking, it is not yet likely done. And, if you are thinking to yourself that this market has NOT been easy . . you would be correct!!!! Yet, I think we have done rather well with the hand we have been dealt, as we have been able to catch just about all the turns.
Expect more of the same in the coming weeks, even if we hold over the important 3185/3200 region of support. Remember, over that support, the bulls have the ball and are trying to drive towards another touchdown in the 3320-40 region. It would take a break of at least the 3200ES region to cause a fumble, with a continuation below 3185 giving the bears the ball. Below 3115, and the bears would be in field position to score themselves. But, as you can see, right now, the bulls are driving hard and are within the red zone.