Battling For The Ball
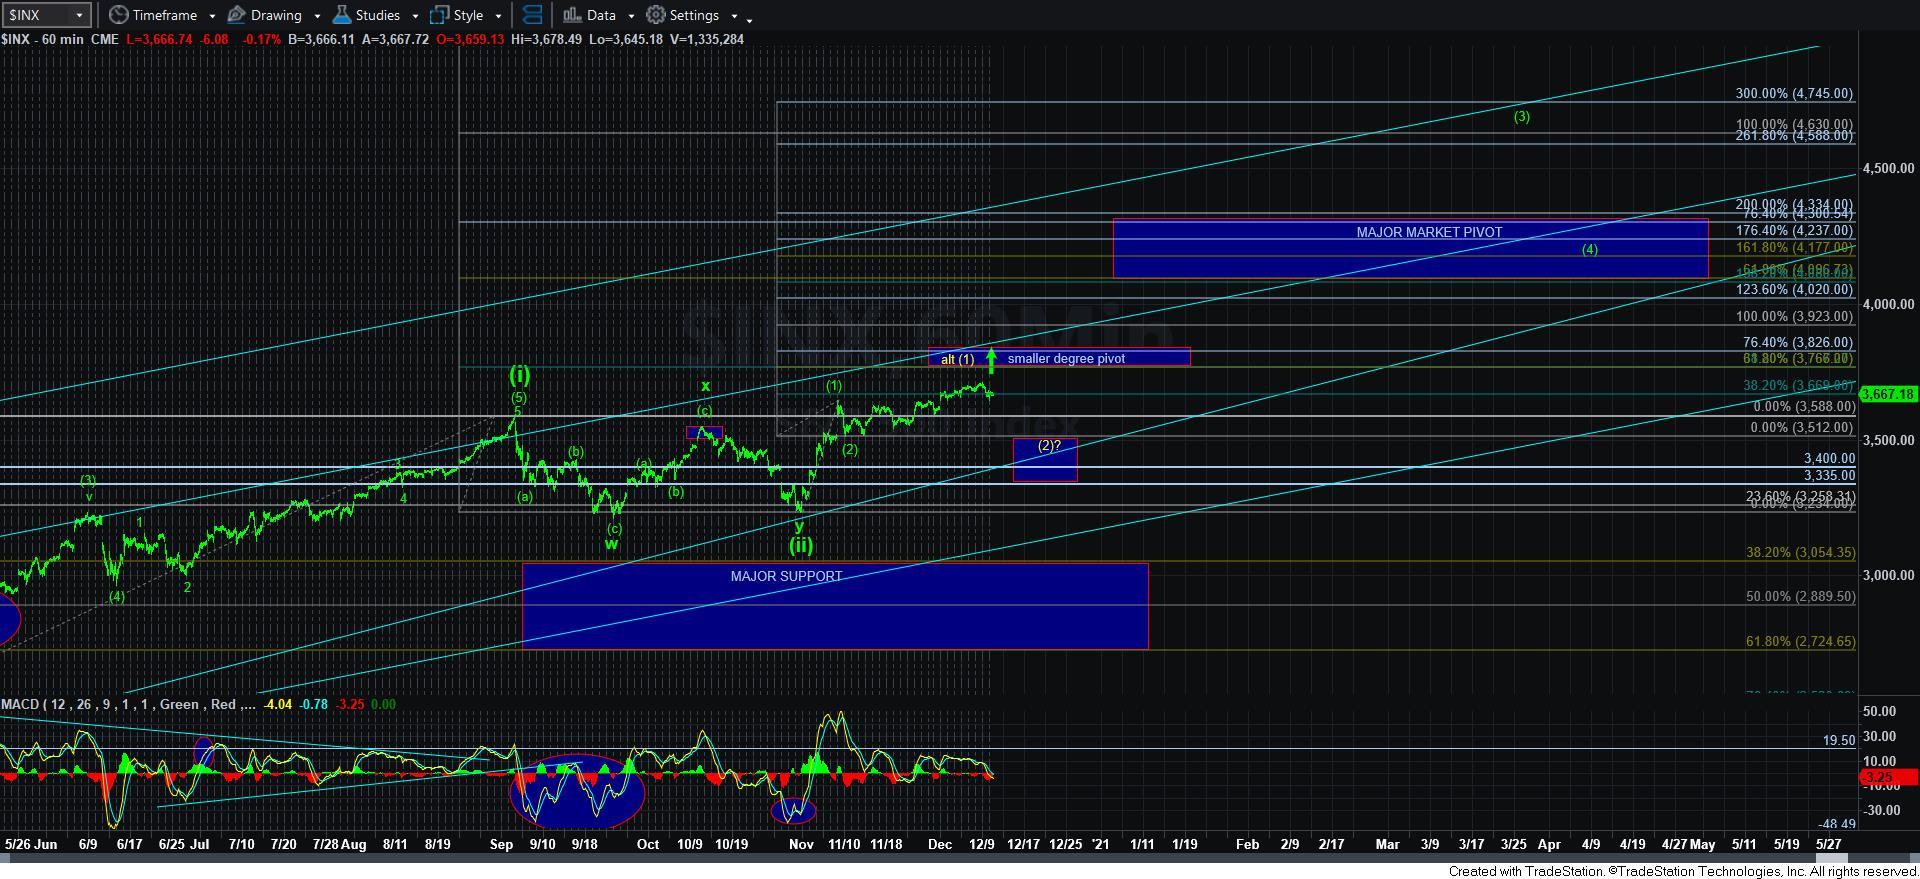
I want to start this update by reiterating a point I have been trying to make over the last several weeks. There are two issues that are keeping me from pounding the table on the immediate bullish side of the market at this very moment. The first issue is the almost non-existent wave [2] upon which I would have to rely in order to assume we are in wave [3] of [iii], which can be seen on the 60-minute chart. The second issue is that the overlapping structure we have seen throughout all of November and into early December does not lend itself to a confident micro count.
If the market would have given us a reasonable wave [2] retracement already, it would have been much easier to deal with the second issue noted above. But, without a wave [2] upon which I can strongly rely, I must allow the price action prove to me that we are in wave [3]. This has been my sticking point for weeks, and why I have still not been convinced that are in the heart of the 3rd wave just yet.
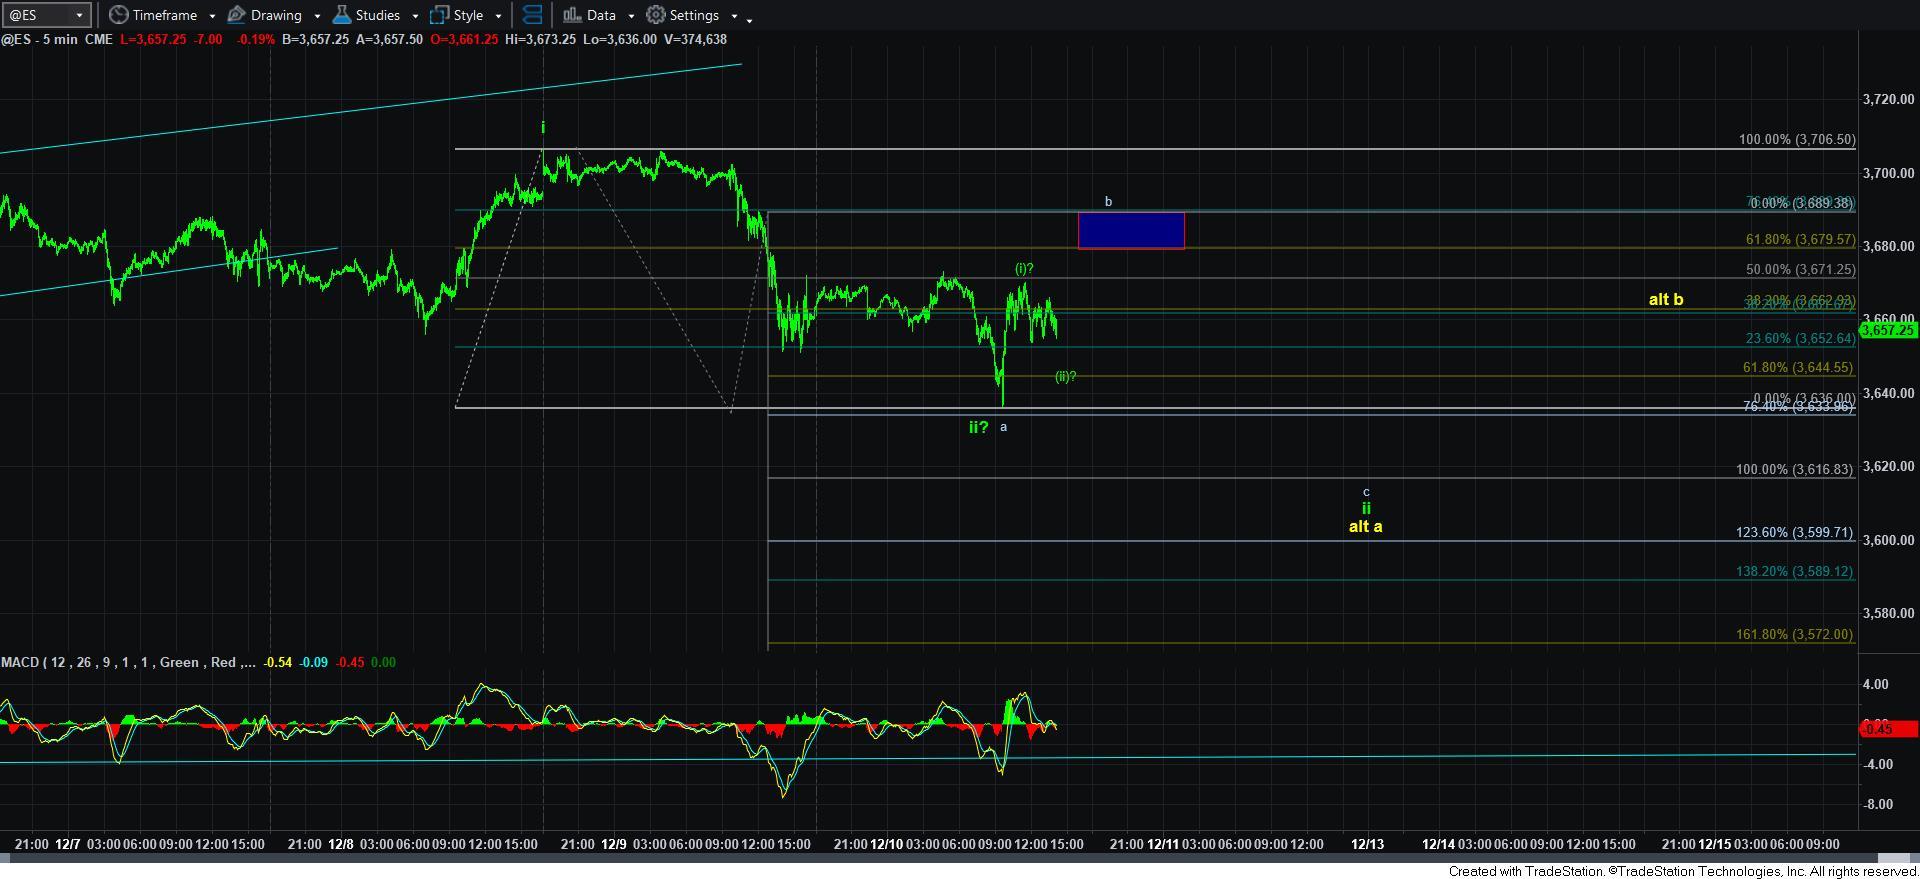
The market is again attempting to set up a potential rally to prove it to me within the micro [i][ii] structure outlined on the 5-minute chart. But, in order to trigger this potential, we will need to hold over today’s low, and rally through the resistance box I have outlined on the attached ES chart. (PLEASE NOTE THAT MY ES CHART IS ON THE MARCH 2021 CONTRACT).
So, on the ES chart, I have outlined the more immediate “bearish” potential I am seeing at this time. And, it all rests around the market not breaking out through the blue resistance box overhead. As long as that is respected, we can continue to develop the pattern to the downside in a potential wave [2], as outlined in yellow.
In the more immediate bullish case scenario, what I am counting as wave i of 3 topped out yesterday, and today we seem to have bottomed at the .618 retrace of that wave i and rallied in what looks like a 5-wave structure off the low today. That is quite often a bullish indication of a continuation rally potentially about to take hold.
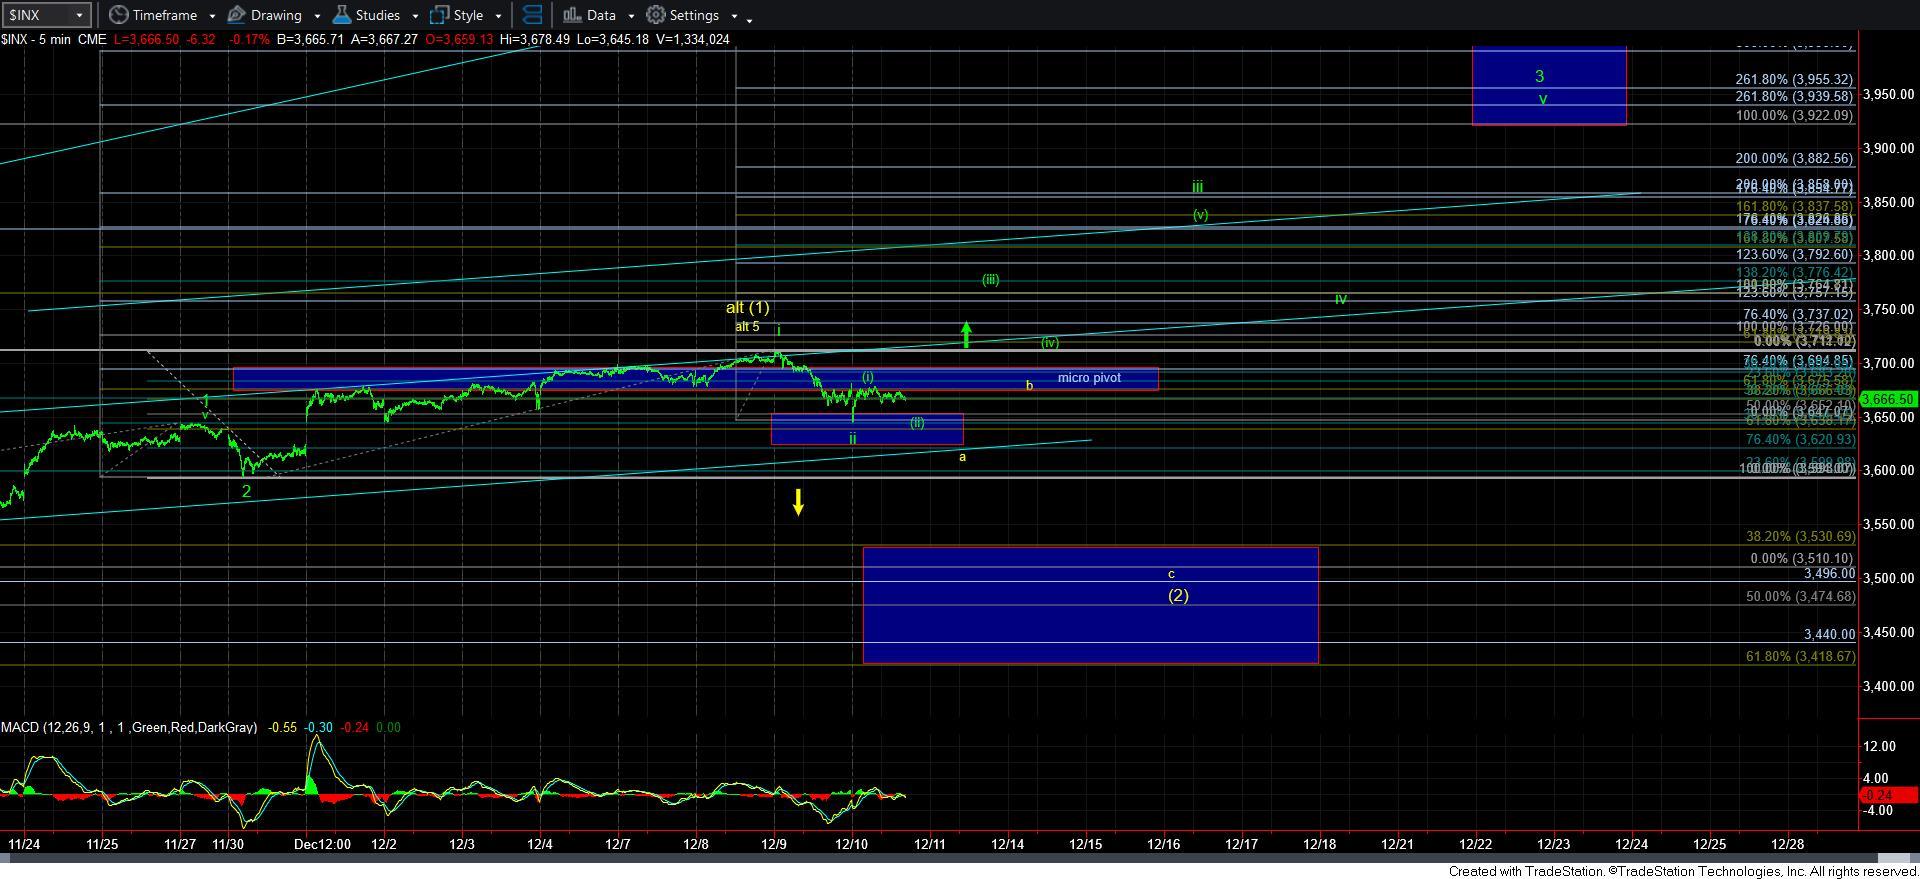
So, if the market is able to break out through the resistance noted on the ES chart, then the bulls have the ball, and will next continue to rally through the 3725SPX region in what I would count was wave [iii] of iii of 3, as you can see on the attached 5-minute SPX chart. The target for that wave 3 would be in the 3922 region as a minimum target for that wave degree.
But, I am again going to add one more warning which is necessary at this point in time. The market can even rally directly up to the 3760SPX region from here, and I will still keep that alt [1] in yellow on the chart due to the overlapping structure off the early November lows. However, if we rally that high, and then pullback correctively and hold support over 3700SPX, then I have no choice but to adopt the micro wave [2] as I now have it in green on the 60-minute chart. But, again, it is still very hard for me to adopt that until the market proves it to me. And, the only reason I have it as my “primary” right now is due to my recognition of this being a bull market and I am forced to give the bulls the benefit of the doubt within this type of environment. Yet, I am going to reiterate my “preference” for a more reasonable and standard wave [2] to be seen, which is presented in yellow.