Battle Over Support - Market Analysis for Jun 10th, 2020
The structure we are now seeing in the futures, and to some extent in the SPX as well, is exceptionally overlapping and corrective looking. Yet, such action can be interpreted in several ways.
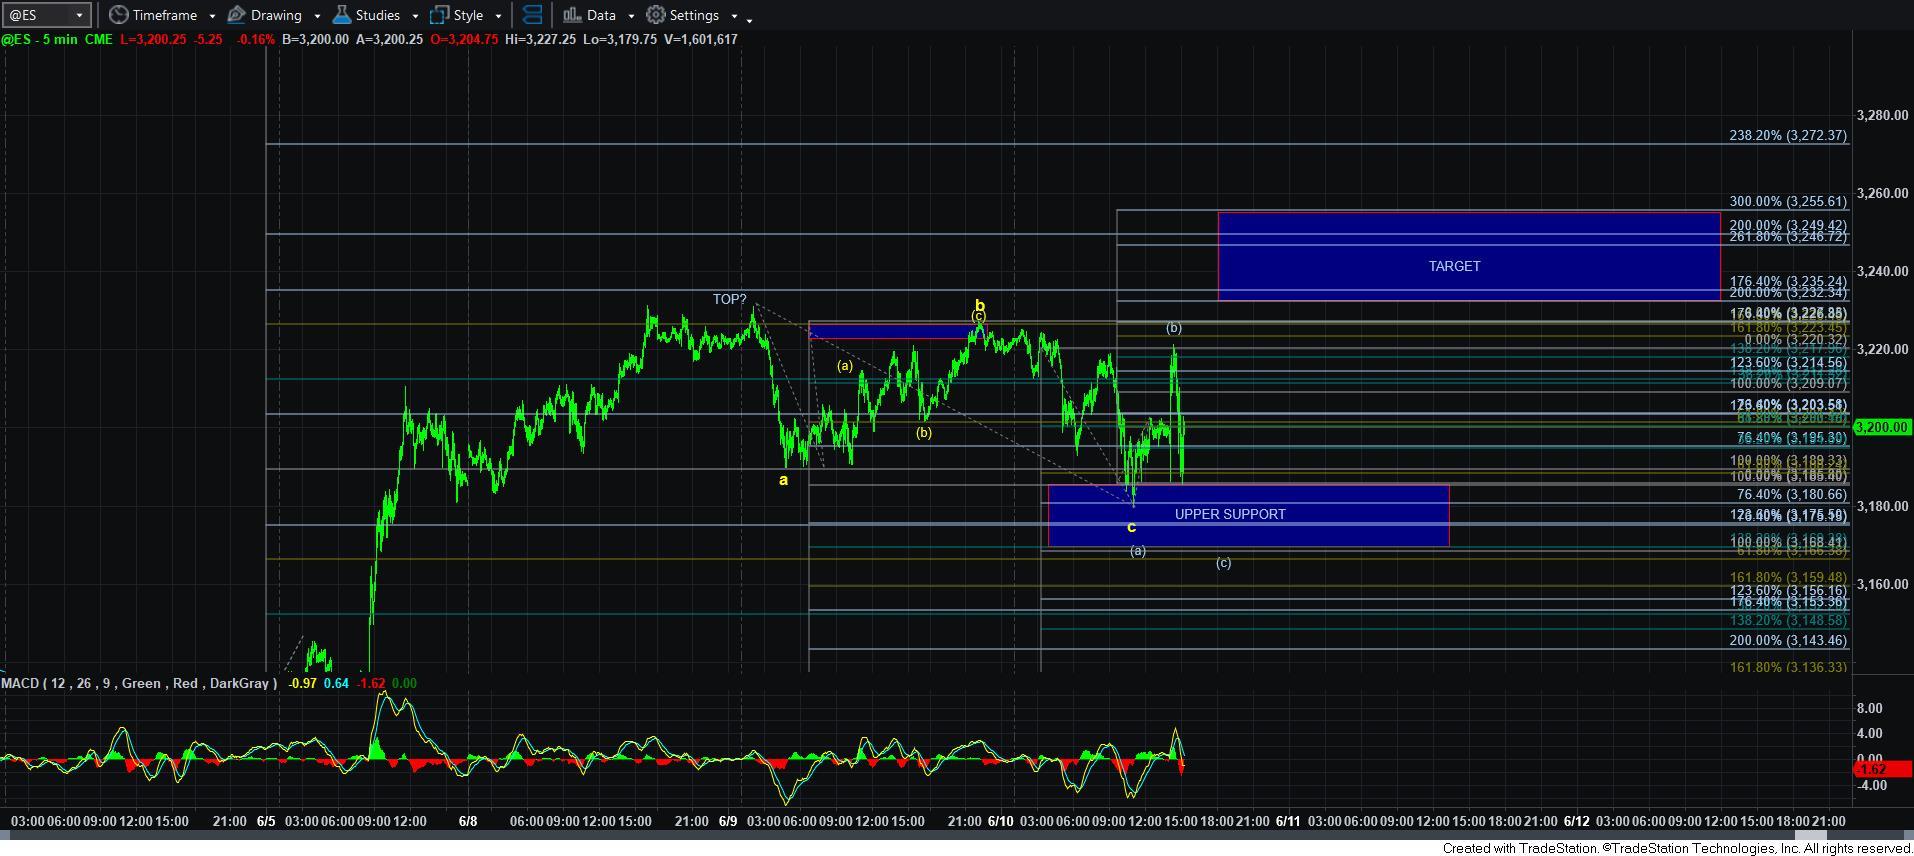
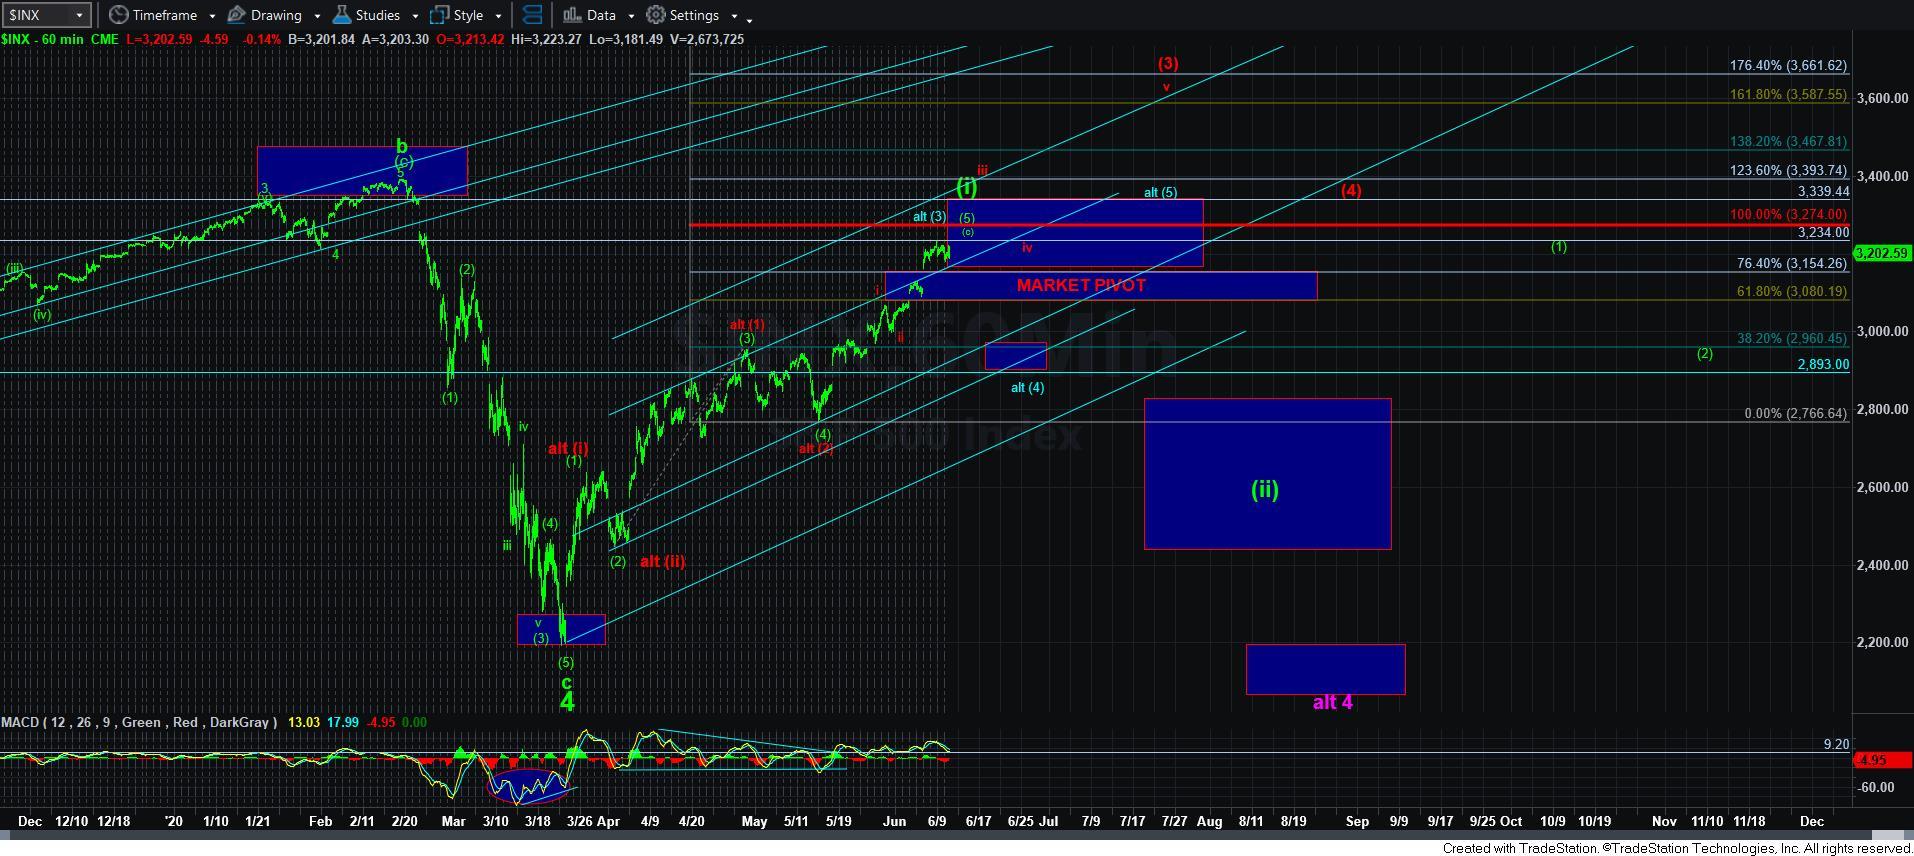
First, keep in mind that the SPX broke out over the uptrend channel I had on my chart, which is not a bearish indication. Moreover, this corrective action has been occurring over that break out point, as we still hold over the trend channel from which we recently broke out. And, should we be able to hold over that, then this action cannot be viewed as bearish. Rather, if we break back into the channel, and follow through below 3150SPX, that would be bearish – at least in the near term.
Alternatively, we have struck our ideal target at 3234SPX (literally within less than a point), and have turned down since. So, if this is distributive action we are seeing in the SPX, w should see follow through below 3150SPX very soon.
But, I want to warn you. While many signs suggest that we should see a break down below 3150SPX, and resulting pullback, as per the blue and green counts, we still have no confirmation break down. So, please do not get prematurely bearish, as it can result in a lot of pain if the market does choose to take the lesser likely red path.
So, for now, that 3150/60SPX support still looms large. And, until we are able to break below that, the market still has a path to the 3250-70 region next. But, I want to reiterate that the weight of evidence still sides with the bigger pullback scenario at this time, especially as long as we remain below 3274SPX.