B-Waves Are Difficult
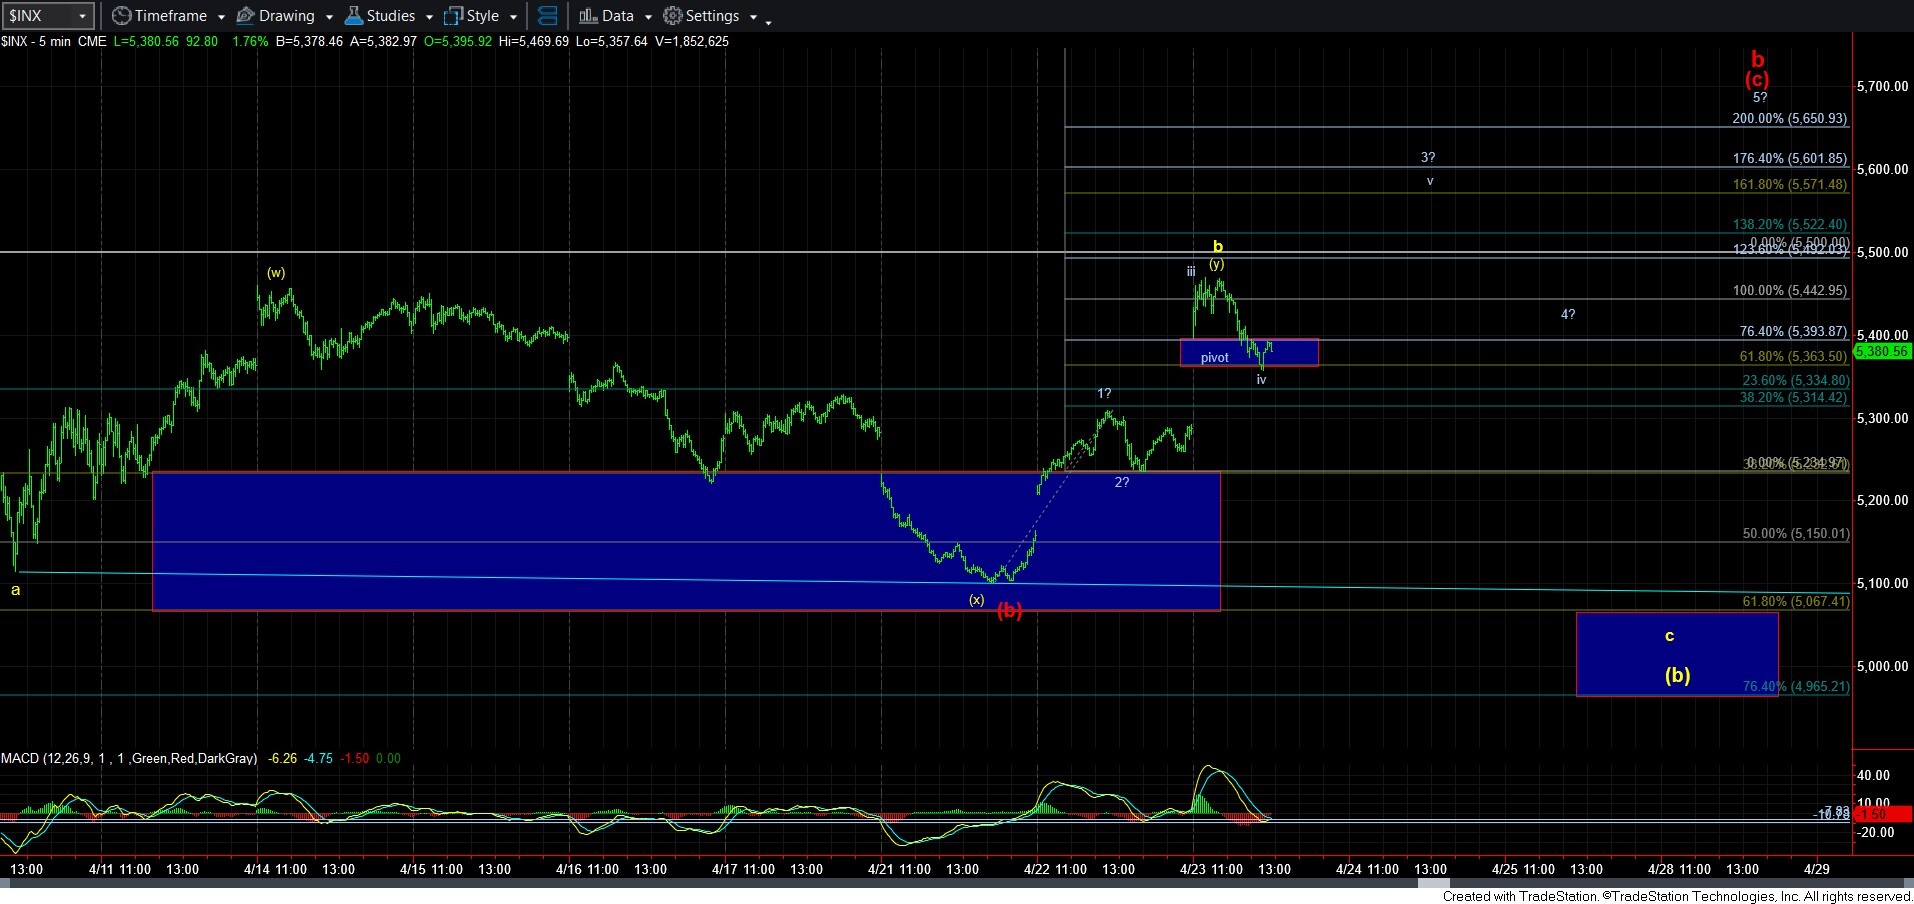
With the market breaking out today again, it is trying to take us in a more direct fashion to completion of the red (c) wave of the red b-wave. But, as I posted this morning, we really have to hold the pivot on a wave iv pullback to make this a higher probability. For now, the market is trying quite hard to do so.
As long as this last pullback low holds as support, the market still has a more direct path higher to complete this larger degree b-wave rally. This is simply following a standard Fibonacci Pinball structure. Remember, wave iii of 3 often targets the 1.00-1.236 extension of waves 1-2, followed by a wave iv pullback to the .618-.764 extensions of waves 1-2 (which I label as our pivot). A break down below the pivot often suggests that the standard impulsive structure is not likely playing out and we have to seek out alternatives and place them to the forefront of probabilities at that time.
Yet, we always have to keep in mind that corrective structures are usually quite complex, with the b-waves within a corrective structure being the most variable and complex wave within the entire Elliott Wave structure. While I was tracking a potential triangle path to extend this (b) wave structure, I am now abandoning that alternative as it would suggest a marginally expanding triangle, which is exceptionally rare.
So, I am now adopting a complex (w)(x)(y) structure for a b-wave within the (b) wave, as shown on the 5-minute SPX chart. While it is a complex overall structure, it does suggest that the [b] wave may again attempt targeting the .618 retracement for the [b] wave bottom, from which we came up a bit short at the low earlier this week.
In summary, I want to remind you that we are in a larger degree corrective structure, and the last low not only came up a bit short of the ideal target earlier this week, along with looking a bit incomplete. So, do not completely dismiss the alternative I am presenting in yellow. But, as long as we hold this afternoon low we just struck, it is reasonable to look up for now. If the rally off this low turns corrective, then it could portend a break down below today’s pullback low, and open the door to the yellow c-wave decline to the support box below.
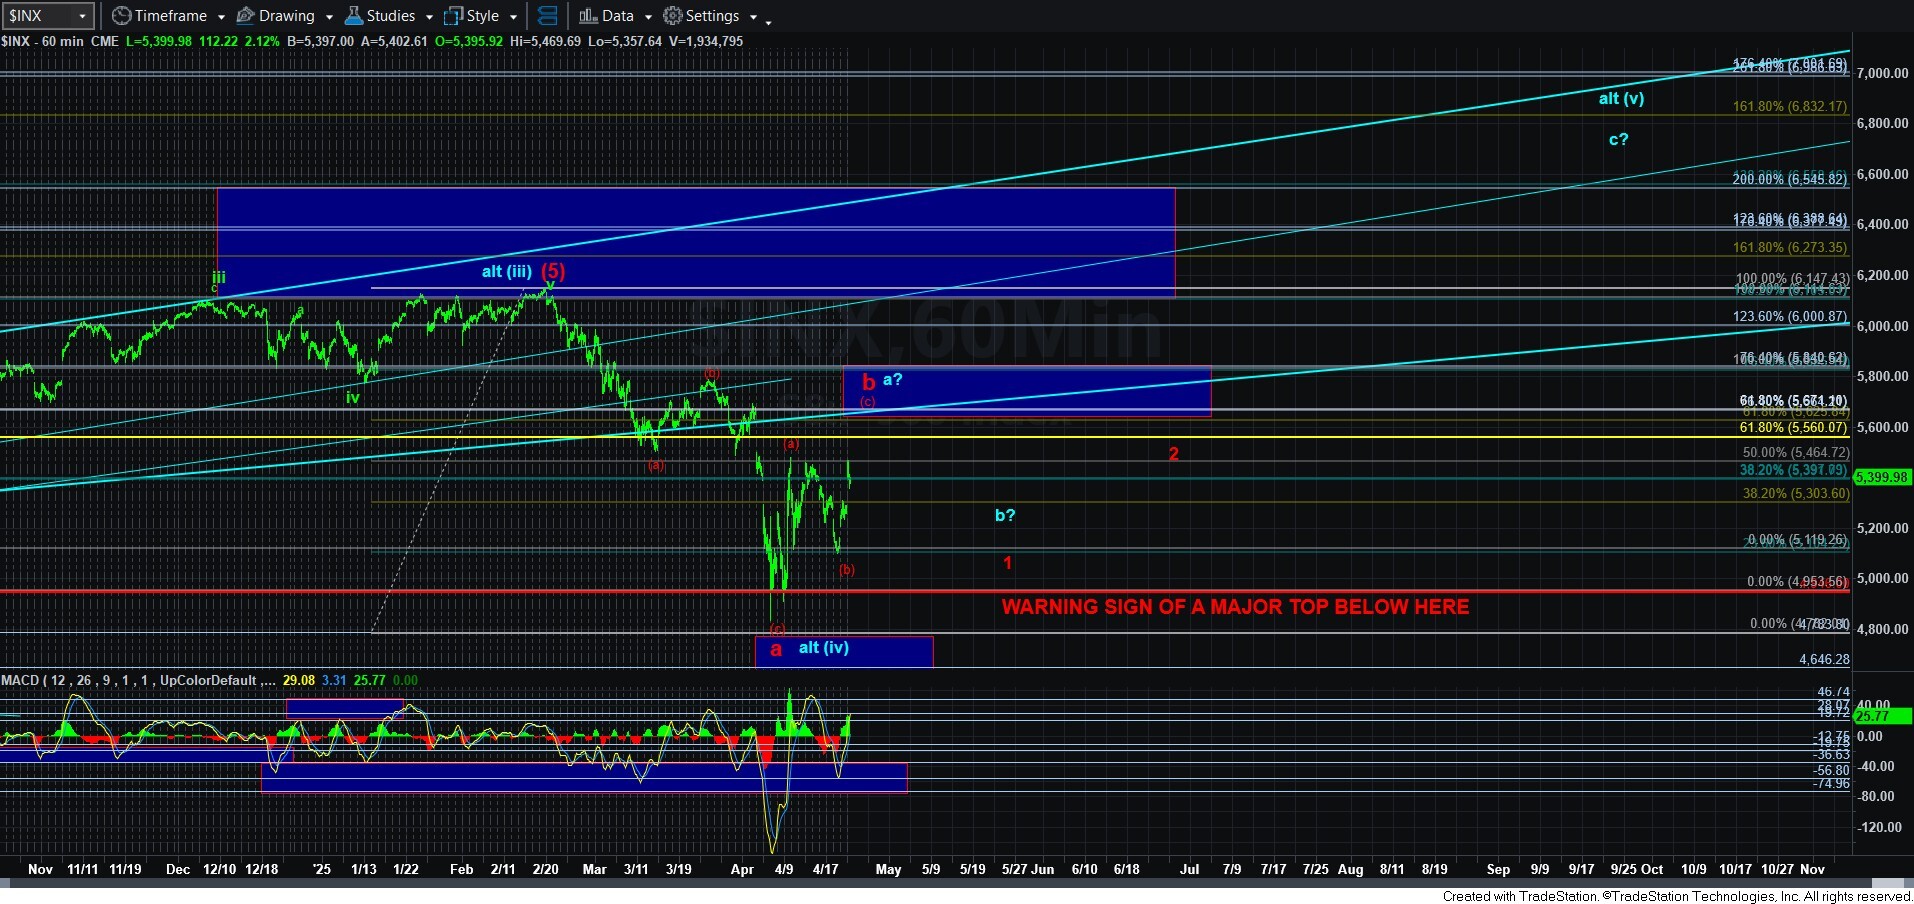
Lastly, I am changing the alternative count color on the 60 minute SPX chart to blue, so you do not get confused with this smaller degree yellow count. But I am having trouble saving the changes to the chart right now, and wanted to get the update out ASAP. So, I will post the 60-minute chart a bit later here.