At Inflection Point - Market Analysis for Jul 12th, 2023
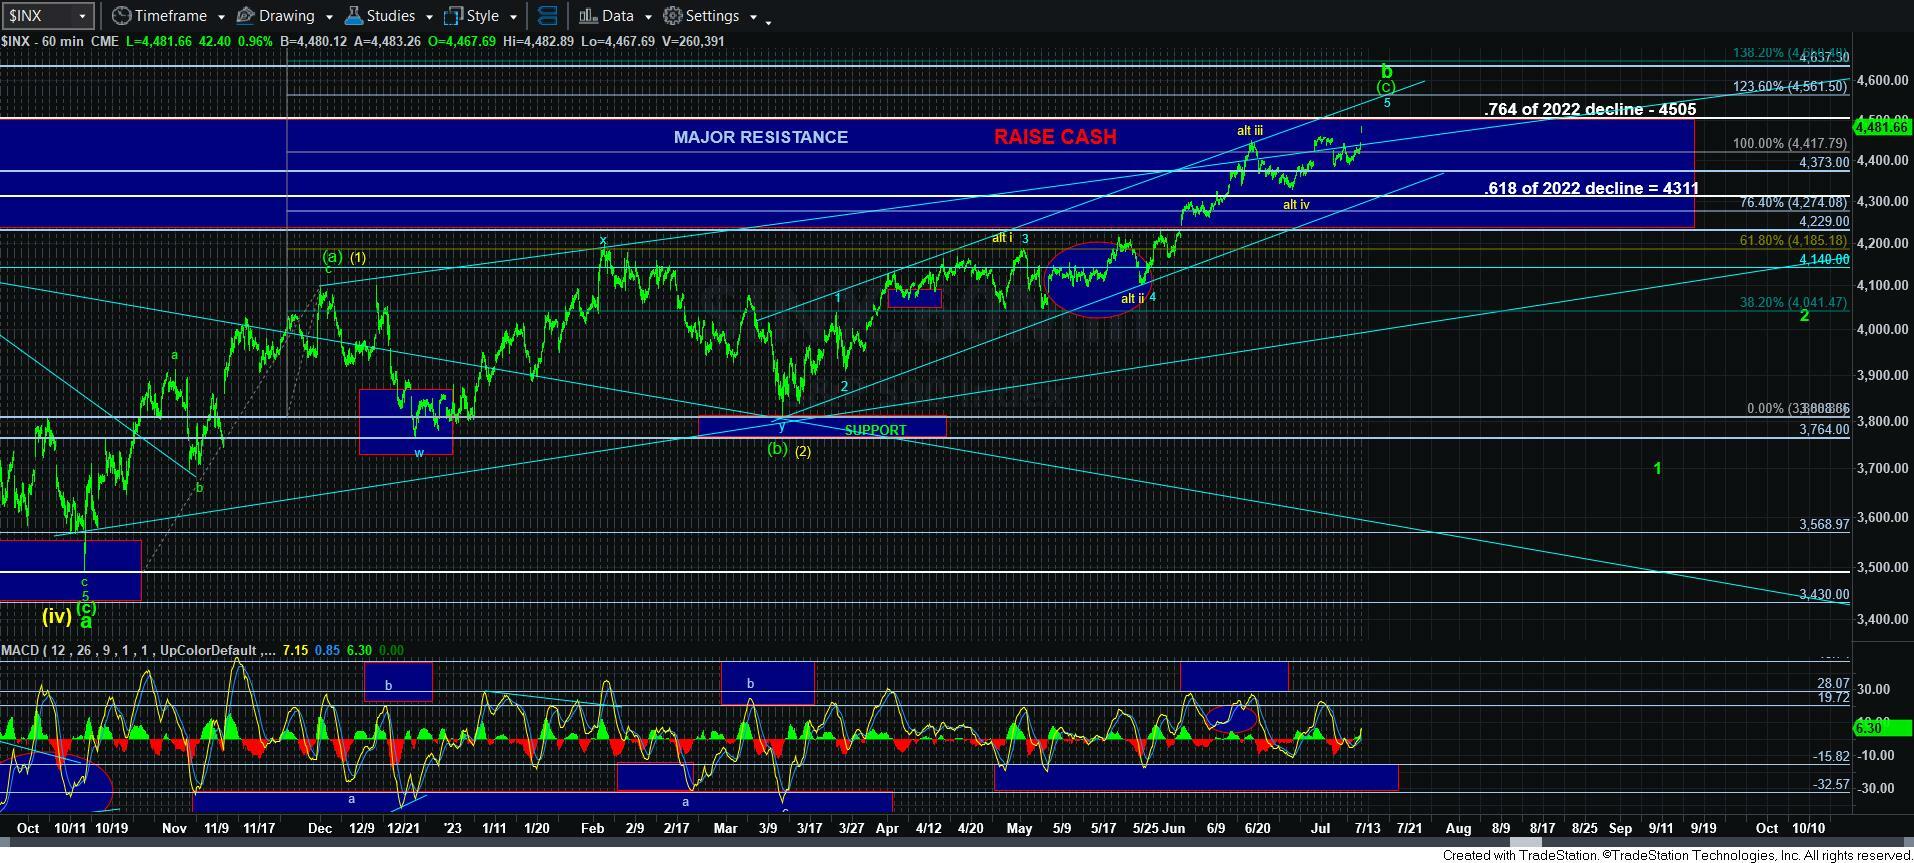
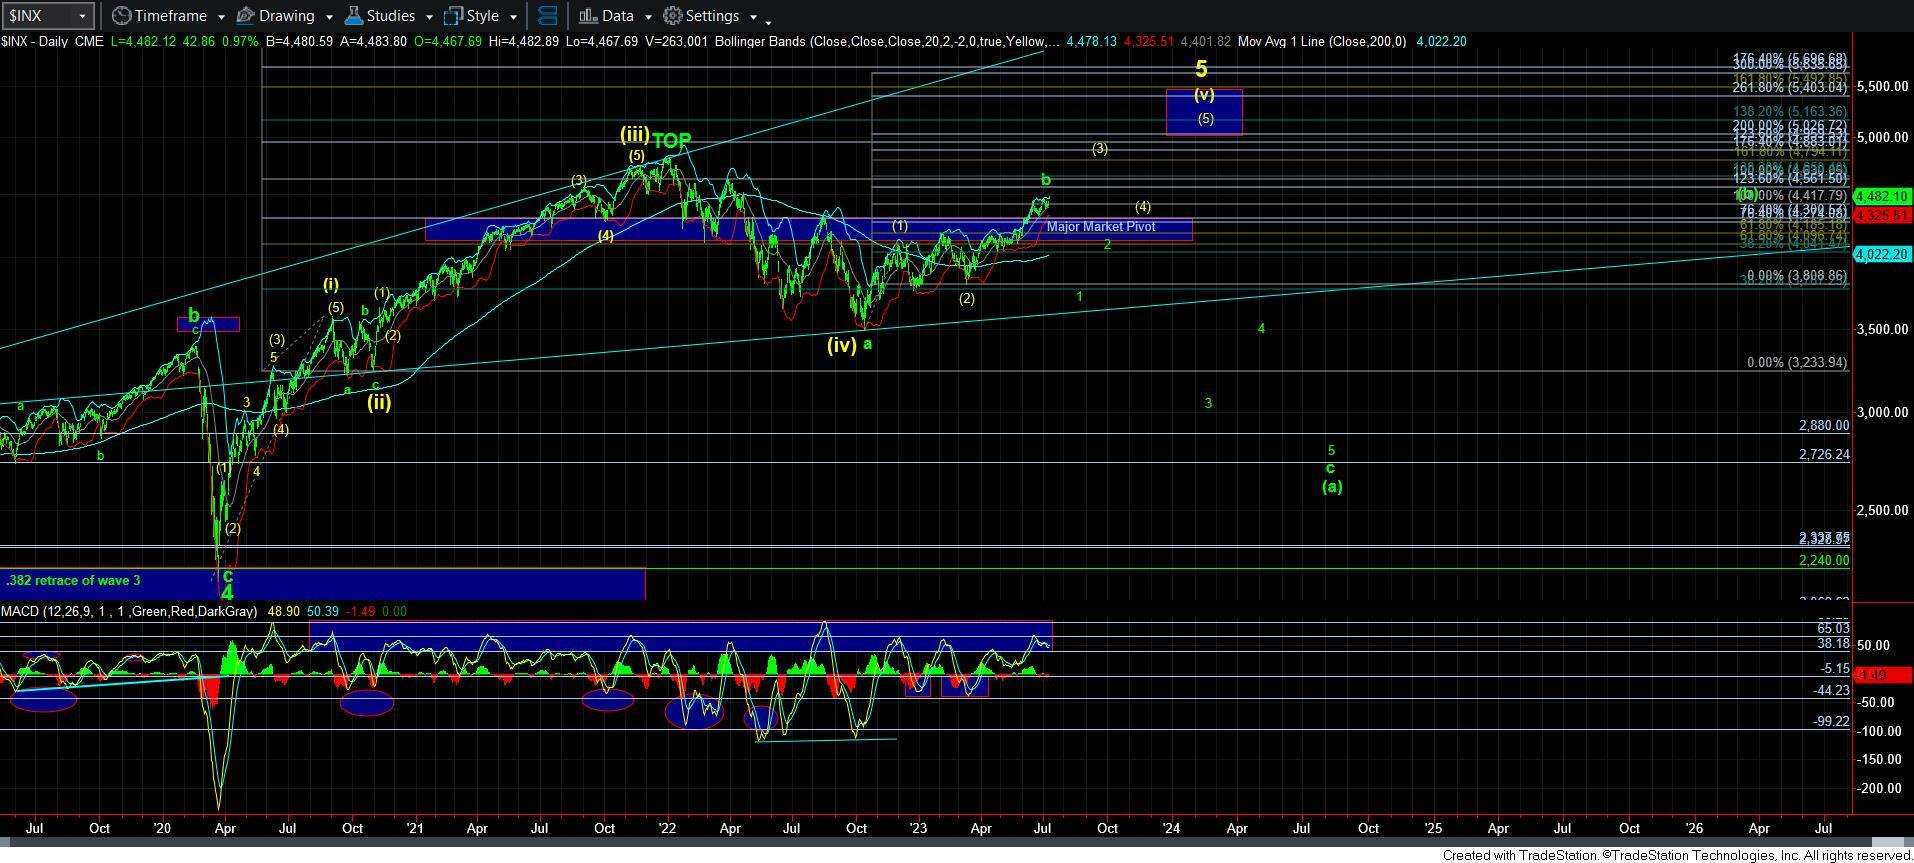
I am sending this update out early, as I want everyone to be focused on the appropriate parameters right now. It is quite clear that the market chose the direct move to the target we had for this structure. Will it top and drop? I cannot tell you that as I am not a prophet. But, it clearly has a set up to do so. Moreover, the drop can be quite significant if we begin to drop in a 5-wave structure, which would confirm the b-wave top we have been potentially tracking. It is for this reason I have been VERY cautious up here.
Now, in moving into the micro count a bit more, I have been noting this week that it was not likely that the 4558SPX high we struck last week was the high for this move. The reason I have noted that was because it completed in a 3-wave structure. And, 3 wave structures do not provide us with high probability tops. Therefore, it was reasonable to expect a higher high.
When we do see a 3-wave rally top, we have to assume it is one of two structures. Either it is a (b) wave high, which was the prior purple count, or it was part of a diagonal.
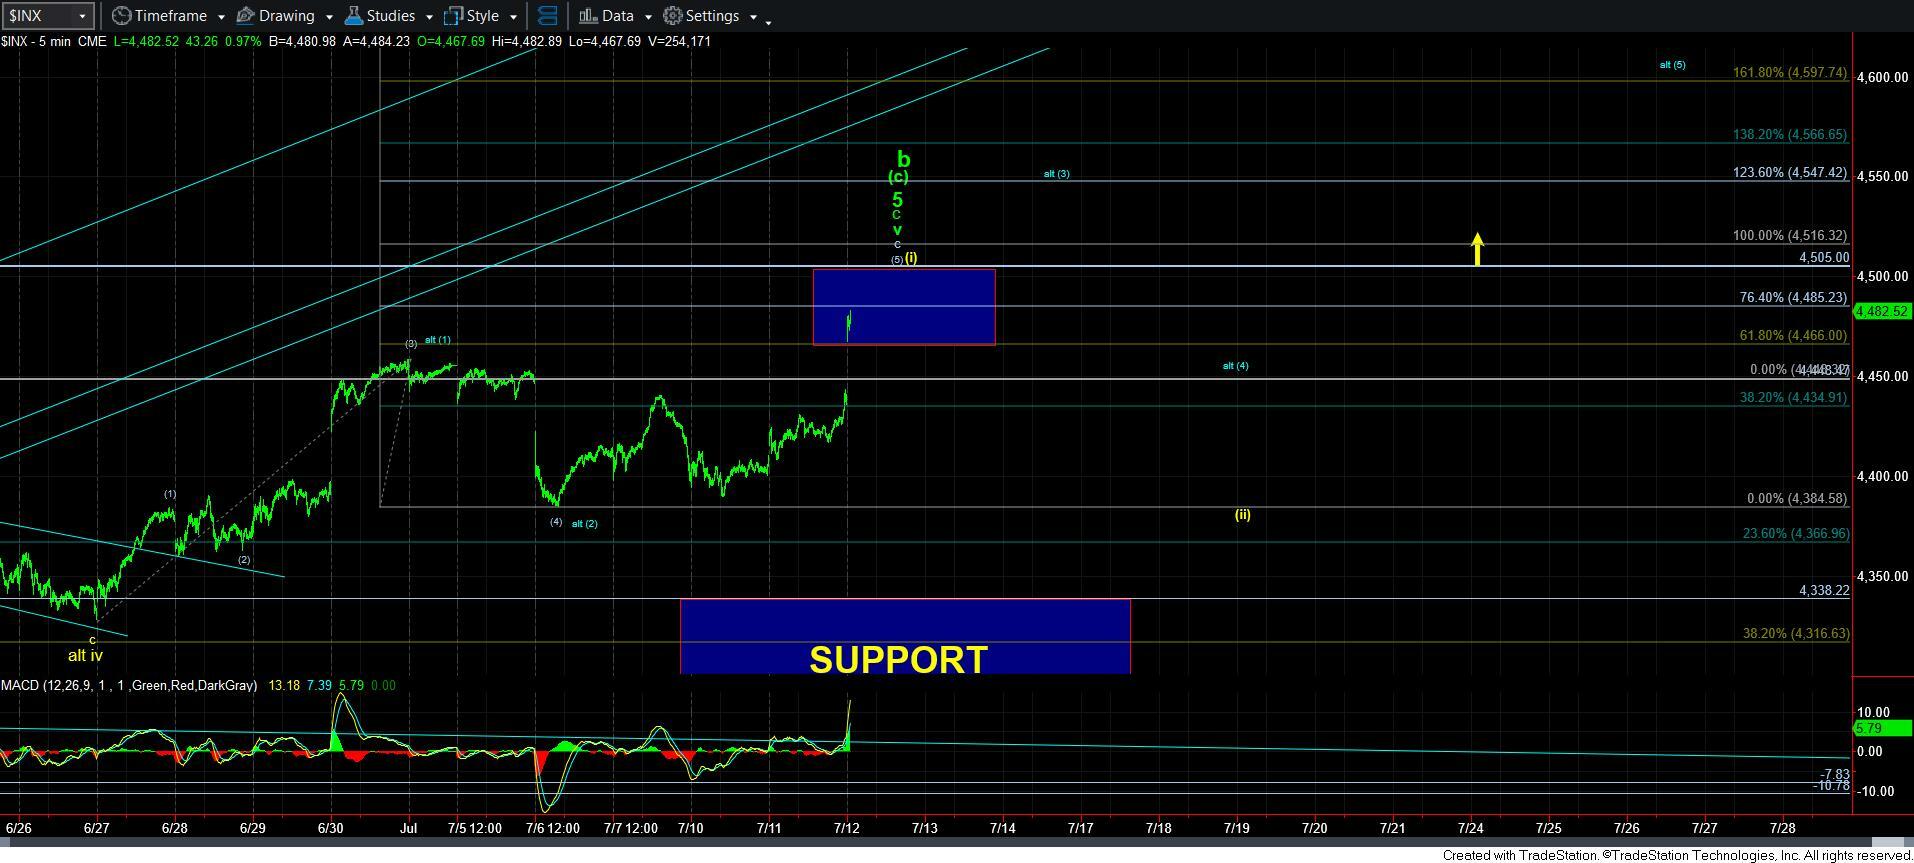
In our case, it is likely part of a diagonal. And, in the primary count, this rally is a 5th wave in that diagonal. What we often see in diagonals is a spike high, followed by a strong spike reversal. That is our first signal of a top. And, we will then have to determine if that drop is impulsive (green count pointing to 3000 or lower) or corrective (yellow count pointing to 4800SPX next).
In the meantime, since I need an alternative for this smaller degree rally, I have added blue notations. As I just noted, when we see a 3-wave rally, we have to consider this as a diagonal. But, a diagonal should have a certain point at which it would turn down if this is wave [5], as per the primary count for the diagonal I am following. That is the 4516SPX level. Therefore, that is my maximum expectation at this time for this particular count. Should the market be able to exceed that level, then I have to assume the diagonal is playing out as per the alternative presented in blue. That would suggest we can continue to rally to the 4550SPX region for just wave [3) in blue in that larger diagonal, pullback in wave [4] to a little lower than where we are now, and then rally up to the 4600SPX region for a more protracted ending diagonal structure.
I want to also reiterate that most of you should not be shorting prematurely. And, this is something I have been stressing for MANY months, and I hope my urging has been effective in preventing many of you from losing money during this rally which has seen bearish sentiment almost the entire way up. However, as Keynes said, the market can remain rational longer than you can remain solvent in your short positions. So, I am strongly urging you to wait for a CLEAR 5-wave decline followed by a 3-wave corrective bounce before you consider shorting this market. If we are indeed going to see a VERY large c-wave decline to 3000 or lower, there is a LOT of room below us and you will likely have several opportunities to layer in short trades. Until such time, PLEASE do not get in the way of price action until the market has provided us with an initial confirmation of a larger degree decline beginning.
For now, it is still advisable that you raise stops on all your long positions, or even raise cash, as I continue to do both. Moreover, we have very specific parameters to follow now., and the paths as laid out above.
I will likely write another update later today, as we are at an important juncture.


